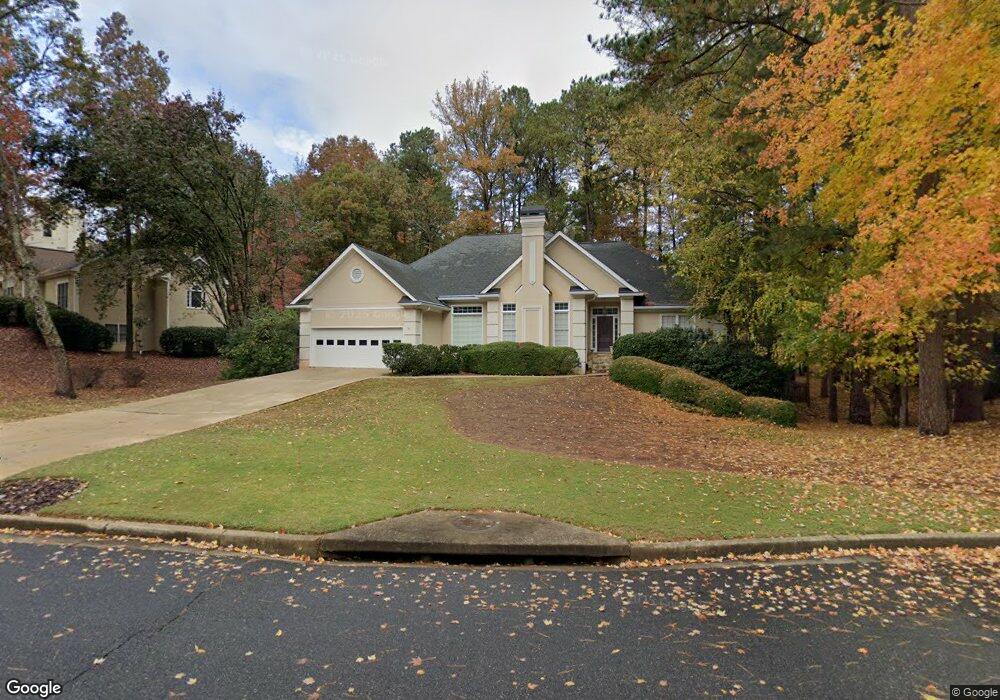
3370 Lakewind Way Unit 11 Alpharetta, GA 30005
Windward NeighborhoodEstimated Value: $688,000 - $848,000
4
Beds
3
Baths
2,861
Sq Ft
$272/Sq Ft
Est. Value
About This Home
This home is located at 3370 Lakewind Way Unit 11, Alpharetta, GA 30005 and is currently estimated at $778,253, approximately $272 per square foot. 3370 Lakewind Way Unit 11 is a home located in Fulton County with nearby schools including Lake Windward Elementary School, Webb Bridge Middle School, and Alpharetta High School.
Ownership History
Date
Name
Owned For
Owner Type
Purchase Details
Closed on
Sep 11, 2023
Sold by
Blazovich Suzanne E
Bought by
Egan Sean C and Flack Anna Claire
Current Estimated Value
Home Financials for this Owner
Home Financials are based on the most recent Mortgage that was taken out on this home.
Original Mortgage
$539,116
Outstanding Balance
$527,682
Interest Rate
6.96%
Mortgage Type
New Conventional
Estimated Equity
$250,571
Purchase Details
Closed on
May 7, 2002
Sold by
Dunham Jean M
Bought by
Blazovich Suzanne E
Home Financials for this Owner
Home Financials are based on the most recent Mortgage that was taken out on this home.
Original Mortgage
$200,000
Interest Rate
6.98%
Mortgage Type
New Conventional
Purchase Details
Closed on
Jun 30, 2000
Sold by
Langer Larry M and Langer Orlew D
Bought by
Dunham Jean M
Home Financials for this Owner
Home Financials are based on the most recent Mortgage that was taken out on this home.
Original Mortgage
$236,000
Interest Rate
8.54%
Mortgage Type
New Conventional
Create a Home Valuation Report for This Property
The Home Valuation Report is an in-depth analysis detailing your home's value as well as a comparison with similar homes in the area
Home Values in the Area
Average Home Value in this Area
Purchase History
| Date | Buyer | Sale Price | Title Company |
|---|---|---|---|
| Egan Sean C | $730,000 | -- | |
| Blazovich Suzanne E | $302,000 | -- | |
| Dunham Jean M | $295,000 | -- |
Source: Public Records
Mortgage History
| Date | Status | Borrower | Loan Amount |
|---|---|---|---|
| Open | Egan Sean C | $539,116 | |
| Previous Owner | Blazovich Suzanne E | $200,000 | |
| Previous Owner | Dunham Jean M | $236,000 |
Source: Public Records
Tax History Compared to Growth
Tax History
| Year | Tax Paid | Tax Assessment Tax Assessment Total Assessment is a certain percentage of the fair market value that is determined by local assessors to be the total taxable value of land and additions on the property. | Land | Improvement |
|---|---|---|---|---|
| 2025 | $1,347 | $310,240 | $65,280 | $244,960 |
| 2023 | $1,347 | $248,440 | $59,080 | $189,360 |
| 2022 | $2,497 | $209,560 | $34,640 | $174,920 |
| 2021 | $2,468 | $181,560 | $33,640 | $147,920 |
| 2020 | $2,466 | $178,360 | $31,040 | $147,320 |
| 2019 | $0 | $178,360 | $31,040 | $147,320 |
| 2018 | $2,313 | $178,360 | $31,040 | $147,320 |
| 2017 | $2,411 | $140,000 | $15,640 | $124,360 |
| 2016 | $2,587 | $149,960 | $19,640 | $130,320 |
| 2015 | $2,173 | $149,960 | $19,640 | $130,320 |
| 2014 | $2,340 | $136,480 | $17,880 | $118,600 |
Source: Public Records
Map
Nearby Homes
- 2800 Lakewind Ct
- 1075 Carnoustie Ln
- 520 Flying Scot Way
- 5200 Cresslyn Ridge
- 1895 Oak Tree Hollow
- 1315 Portmarnock Dr
- 2250 Blackheath Trace
- 440 Newport Heights
- 1620 Silverleaf Way
- 1140 Park Glenn Dr
- 4440 Webb Bridge Rd
- 680 Kimball Parc Way
- 690 Kimball Parc Way
- 1200 Bay Pointe Terrace
- 485 Portrait Cir
- 3020 Bent Creek Terrace
- 1225 Bay Pointe Terrace
- 4905 Weathervane Dr
- 3350 Lakewind Way
- 3380 Lakewind Way
- 225 Lake Pines Pointe
- 235 Lake Pines Pointe
- 3379 Lakewind Way
- 3389 Lakewind Way Unit 2
- 3330 Lakewind Way
- 3400 Lakewind Way
- 3369 Lakewind Way
- 215 Lake Pines
- 215 Lake Pines Pointe
- 3399 Lakewind Way Unit 11
- 240 Lake Pines
- 240 Lake Pines Pointe
- 3320 Lakewind Way
- 3357 Lakewind Way
- 205 Lake Pines Pointe
- 205 Lake Pines
- 3345 Lakewind Way
- 540 Stonebury Dr