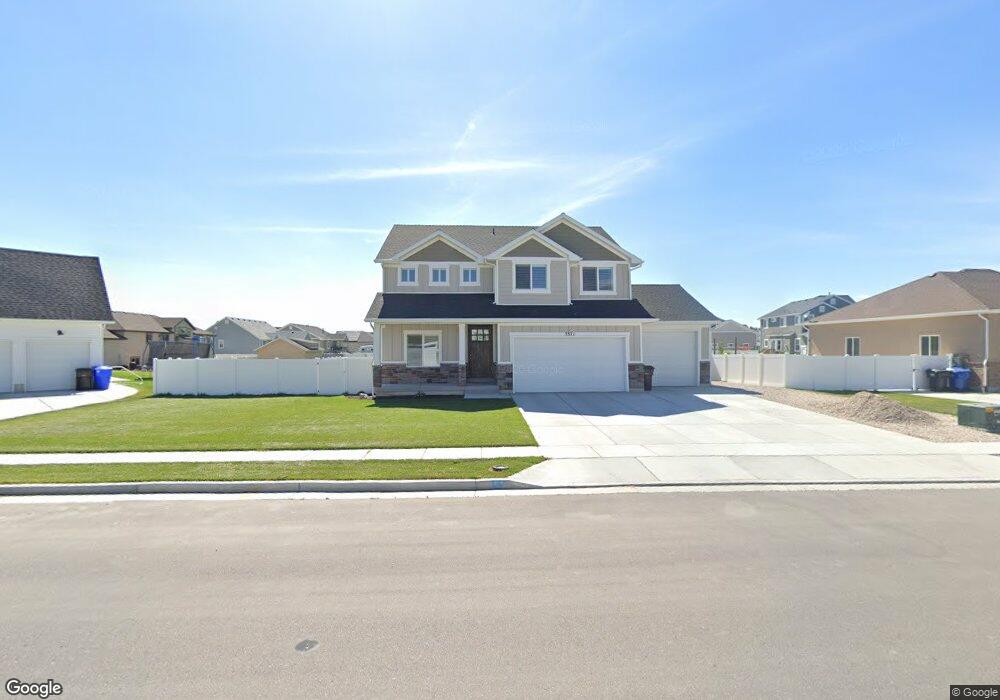
3371 N 2675 W Farr West, UT 84404
Estimated Value: $685,000 - $691,000
4
Beds
3
Baths
2,480
Sq Ft
$278/Sq Ft
Est. Value
About This Home
This home is located at 3371 N 2675 W, Farr West, UT 84404 and is currently estimated at $688,564, approximately $277 per square foot. 3371 N 2675 W is a home located in Weber County with nearby schools including Wahlquist Junior High School and Fremont High School.
Ownership History
Date
Name
Owned For
Owner Type
Purchase Details
Closed on
May 27, 2022
Sold by
King Ii James P and King Jaimie L
Bought by
J & J King Family Trust
Current Estimated Value
Purchase Details
Closed on
Nov 29, 2018
Sold by
Boyer Susan J
Bought by
King James P and King Jaimie L
Home Financials for this Owner
Home Financials are based on the most recent Mortgage that was taken out on this home.
Original Mortgage
$349,000
Interest Rate
4.8%
Mortgage Type
New Conventional
Purchase Details
Closed on
Jul 28, 2017
Sold by
Cody Rhees Construction Inc
Bought by
Boyers Susan J
Home Financials for this Owner
Home Financials are based on the most recent Mortgage that was taken out on this home.
Original Mortgage
$319,410
Interest Rate
3.9%
Mortgage Type
New Conventional
Purchase Details
Closed on
Feb 7, 2017
Sold by
Remuda Court Llc
Bought by
Cody Rhees Construction Inc
Home Financials for this Owner
Home Financials are based on the most recent Mortgage that was taken out on this home.
Original Mortgage
$288,000
Interest Rate
4.32%
Mortgage Type
New Conventional
Create a Home Valuation Report for This Property
The Home Valuation Report is an in-depth analysis detailing your home's value as well as a comparison with similar homes in the area
Home Values in the Area
Average Home Value in this Area
Purchase History
| Date | Buyer | Sale Price | Title Company |
|---|---|---|---|
| J & J King Family Trust | -- | Voyant Legal Pllc | |
| King James P | -- | Inwest Title South Ogden | |
| Boyers Susan J | -- | Mountain View Title | |
| Cody Rhees Construction Inc | -- | Mountain View Title |
Source: Public Records
Mortgage History
| Date | Status | Borrower | Loan Amount |
|---|---|---|---|
| Previous Owner | King James P | $349,000 | |
| Previous Owner | Boyers Susan J | $319,410 | |
| Previous Owner | Cody Rhees Construction Inc | $288,000 |
Source: Public Records
Tax History Compared to Growth
Tax History
| Year | Tax Paid | Tax Assessment Tax Assessment Total Assessment is a certain percentage of the fair market value that is determined by local assessors to be the total taxable value of land and additions on the property. | Land | Improvement |
|---|---|---|---|---|
| 2025 | $4,219 | $667,132 | $199,371 | $467,761 |
| 2024 | $4,287 | $360,799 | $109,806 | $250,993 |
| 2023 | $3,803 | $315,150 | $109,602 | $205,548 |
| 2022 | $4,008 | $347,051 | $98,841 | $248,210 |
| 2021 | $3,214 | $455,000 | $113,787 | $341,213 |
| 2020 | $2,955 | $379,000 | $113,787 | $265,213 |
| 2019 | $2,954 | $358,000 | $94,743 | $263,257 |
| 2018 | $3,031 | $354,000 | $79,886 | $274,114 |
| 2017 | $1,545 | $79,755 | $79,755 | $0 |
| 2016 | -- | $0 | $0 | $0 |
Source: Public Records
Map
Nearby Homes
- 3059 N 2825 W
- 3356 N 2900 W
- 2830 W North Plain City Rd
- 3261 2500 W
- 3274 2500 W
- 1158 3425 N Unit 212
- 2878 W North Plain City Rd
- 3268 2425 W
- 2417 W 3200 N
- 3533 Remuda Dr
- 3202 N 2875 W Unit 39
- 2405 W 3200 N
- 3524 N 3000 W
- 3221 N 2875 W Unit 33
- 3190 N 2875 W Unit 38
- 3209 N 2875 W Unit 34
- 2508 W 3000 N
- 2452 W 3000 N
- 3158 W North Plain City Rd
- Aberdeen Plan at Hart Estates - Farr West
- 2688 W 3325 N
- 3373 N 2675 W
- 2689 W 3375 N
- 2714 W 3325 N
- 3366 N 2675 W
- 3372 N 2675 W
- 2740 W 3325 N Unit 116
- 2740 W 3325 N
- 3386 N 2675 W Unit 103
- 3346 N 2675 W
- 3404 N 2675 W
- 2679 W 3325 N Unit 107
- 2679 W 3325 N
- 3328 N 2675 W
- 2705 W 3375 N
- 2774 W 3325 N
- 2697 W 3325 N Unit 108
- 2697 W 3325 N
- 2678 W 3375 N
- 2727 W 3325 N Unit 109