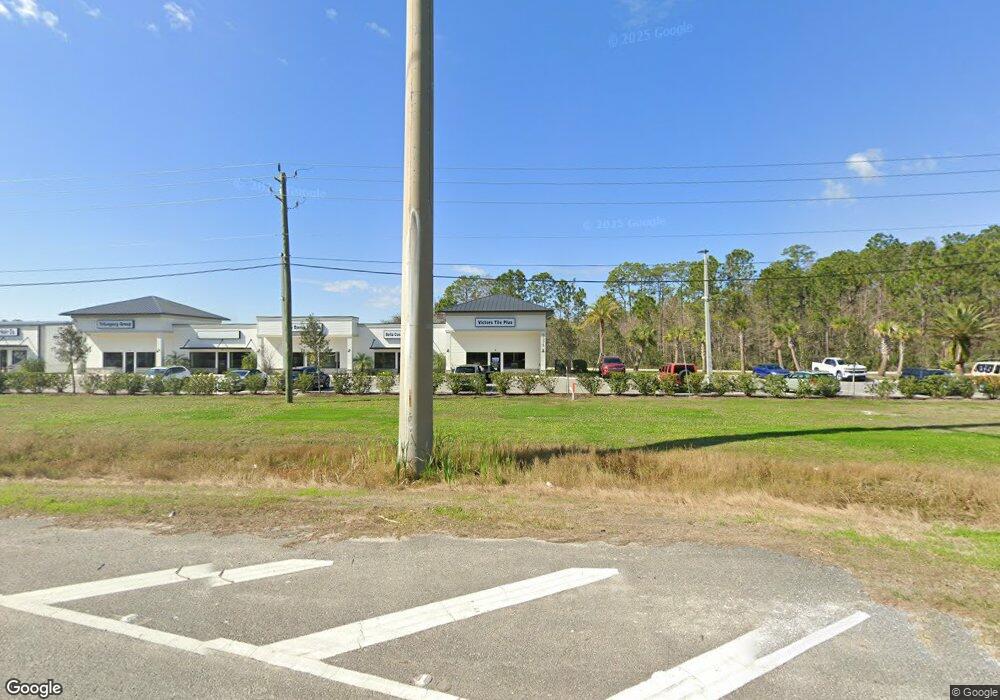
3371 N State St Bunnell, FL 32110
Estimated Value: $1,801,342
--
Bed
--
Bath
7,500
Sq Ft
$240/Sq Ft
Est. Value
About This Home
This home is located at 3371 N State St, Bunnell, FL 32110 and is currently priced at $1,801,342, approximately $240 per square foot. 3371 N State St is a home located in Flagler County with nearby schools including Bunnell Elementary School, Indian Trails Middle School, and Matanzas High School.
Ownership History
Date
Name
Owned For
Owner Type
Purchase Details
Closed on
Apr 20, 2023
Sold by
Vre Holdco Inc
Bought by
Trilegacy Holdings Llc
Current Estimated Value
Purchase Details
Closed on
Jul 11, 2013
Sold by
Vre Holdco Inc
Bought by
Lfc Holdings Fc Llc
Home Financials for this Owner
Home Financials are based on the most recent Mortgage that was taken out on this home.
Original Mortgage
$375,000
Interest Rate
3.79%
Mortgage Type
Purchase Money Mortgage
Create a Home Valuation Report for This Property
The Home Valuation Report is an in-depth analysis detailing your home's value as well as a comparison with similar homes in the area
Home Values in the Area
Average Home Value in this Area
Purchase History
| Date | Buyer | Sale Price | Title Company |
|---|---|---|---|
| Trilegacy Holdings Llc | $100 | None Listed On Document | |
| Lfc Holdings Fc Llc | $750,000 | Attorney |
Source: Public Records
Mortgage History
| Date | Status | Borrower | Loan Amount |
|---|---|---|---|
| Previous Owner | Lfc Holdings Fc Llc | $375,000 |
Source: Public Records
Tax History Compared to Growth
Tax History
| Year | Tax Paid | Tax Assessment Tax Assessment Total Assessment is a certain percentage of the fair market value that is determined by local assessors to be the total taxable value of land and additions on the property. | Land | Improvement |
|---|---|---|---|---|
| 2024 | $45,928 | $2,768,143 | $418,063 | $2,350,080 |
| 2023 | $45,928 | $2,059,426 | $0 | $0 |
| 2022 | $7,303 | $423,273 | $418,063 | $5,210 |
| 2021 | $6,821 | $387,165 | $381,955 | $5,210 |
| 2020 | $5,444 | $255,865 | $250,655 | $5,210 |
| 2019 | $5,499 | $255,865 | $250,655 | $5,210 |
| 2018 | $5,591 | $255,865 | $250,655 | $5,210 |
| 2017 | $5,873 | $255,865 | $250,655 | $5,210 |
| 2016 | $8,639 | $363,662 | $0 | $0 |
| 2015 | $7,828 | $333,002 | $0 | $0 |
| 2014 | $7,924 | $333,129 | $279,095 | $54,034 |
Source: Public Records
Map
Nearby Homes