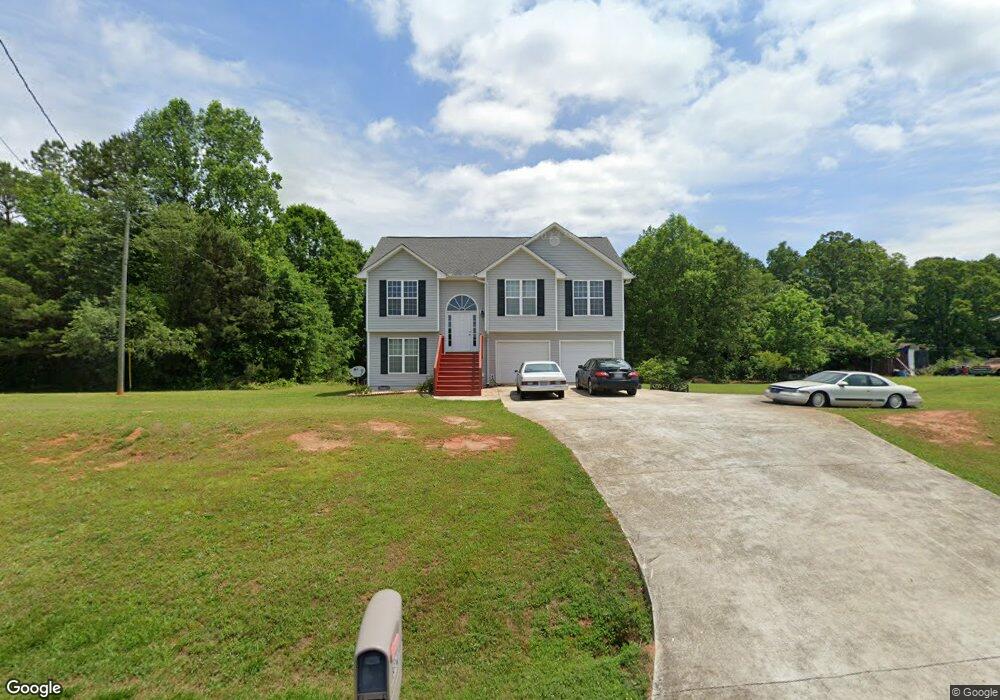
3374 Tower Rd Toccoa, GA 30577
Estimated Value: $366,242 - $780,000
3
Beds
3
Baths
2,250
Sq Ft
$236/Sq Ft
Est. Value
About This Home
This home is located at 3374 Tower Rd, Toccoa, GA 30577 and is currently estimated at $530,061, approximately $235 per square foot. 3374 Tower Rd is a home located in Stephens County with nearby schools including Stephens County High School.
Ownership History
Date
Name
Owned For
Owner Type
Purchase Details
Closed on
Dec 28, 2023
Sold by
Oglesby Rosheenah
Bought by
Oglesby Morris G
Current Estimated Value
Home Financials for this Owner
Home Financials are based on the most recent Mortgage that was taken out on this home.
Original Mortgage
$123,200
Outstanding Balance
$120,535
Interest Rate
6.61%
Mortgage Type
New Conventional
Estimated Equity
$409,526
Purchase Details
Closed on
Dec 1, 2023
Sold by
Oglesby Rosheenah
Bought by
Oglesby Rosheenah and Oglesby Morris G
Home Financials for this Owner
Home Financials are based on the most recent Mortgage that was taken out on this home.
Original Mortgage
$123,200
Outstanding Balance
$120,535
Interest Rate
6.61%
Mortgage Type
New Conventional
Estimated Equity
$409,526
Purchase Details
Closed on
Jun 8, 2006
Sold by
Sims Ellie
Bought by
Oglesby Rosheenah
Home Financials for this Owner
Home Financials are based on the most recent Mortgage that was taken out on this home.
Original Mortgage
$7,500
Interest Rate
6.49%
Mortgage Type
New Conventional
Create a Home Valuation Report for This Property
The Home Valuation Report is an in-depth analysis detailing your home's value as well as a comparison with similar homes in the area
Purchase History
| Date | Buyer | Sale Price | Title Company |
|---|---|---|---|
| Oglesby Morris G | -- | -- | |
| Oglesby Rosheenah | -- | -- | |
| Oglesby Rosheenah | $5,500 | -- |
Source: Public Records
Mortgage History
| Date | Status | Borrower | Loan Amount |
|---|---|---|---|
| Open | Oglesby Morris G | $123,200 | |
| Previous Owner | Oglesby Rosheenah | $7,500 |
Source: Public Records
Tax History
| Year | Tax Paid | Tax Assessment Tax Assessment Total Assessment is a certain percentage of the fair market value that is determined by local assessors to be the total taxable value of land and additions on the property. | Land | Improvement |
|---|---|---|---|---|
| 2025 | $3,251 | $118,423 | $3,005 | $115,418 |
| 2024 | $2,322 | $76,259 | $3,005 | $73,254 |
| 2023 | $2,043 | $70,637 | $3,005 | $67,632 |
| 2022 | $1,935 | $66,995 | $3,005 | $63,990 |
| 2021 | $1,867 | $61,701 | $3,005 | $58,696 |
| 2020 | $1,854 | $60,703 | $3,005 | $57,698 |
| 2019 | $1,680 | $54,967 | $2,862 | $52,105 |
| 2018 | $1,680 | $54,967 | $2,862 | $52,105 |
| 2017 | $1,706 | $54,967 | $2,862 | $52,105 |
| 2016 | $1,680 | $54,966 | $2,861 | $52,105 |
| 2015 | $1,759 | $54,966 | $2,861 | $52,105 |
| 2014 | $1,834 | $56,318 | $2,862 | $53,456 |
| 2013 | -- | $57,096 | $3,576 | $53,520 |
Source: Public Records
Map
Nearby Homes
- 2278 Tower Rd
- 2986 Defoor Rd
- 2230 Tower Rd
- 571 Suttles Rd
- 567 Suttles Rd
- 679 Suttles Rd
- 347 River Trail
- 134 Lakeside Hills Rd
- 410 Lakeside Hills Rd
- 206 Goff Dr
- 0 Cheyenne Trail Unit 10711355
- 120 Bruce Rd Unit LOT 6
- 120 Bruce Rd
- 0 Lakeway Dr Unit 7361717
- 0 Lakeway Dr Unit 10276351
- 3.35 ACRES Keener Rd
- 0 Eagle Claw Ct Unit 7726676
- 0 Eagle Claw Ct Unit 10700597
- 156 Navajo Trail
- 1687 Jenkins Ferry Rd
- 3344 Tower Rd
- 3426 Tower Rd
- 3313 Tower Rd
- 3310 Tower Rd
- 3311 Tower Rd
- 3266 Tower Rd
- 3248 Tower Rd
- 117 Almetie Dr
- 49 Spanish Moss Dr
- 4 Spanish Moss Dr
- 280 N Yow Mill Rd
- 3048 Tower Rd
- 2524 Yow Mill Rd
- 2992 Tower Rd
- 1090 Brookhaven Cir
- 1364 Brookhaven Cir
- 5149 Brookhaven Cir Unit A
- 1158 Brookhaven Cir
- 1367 Brookhaven Cir
- 2908 Tower Rd
Your Personal Tour Guide
Ask me questions while you tour the home.