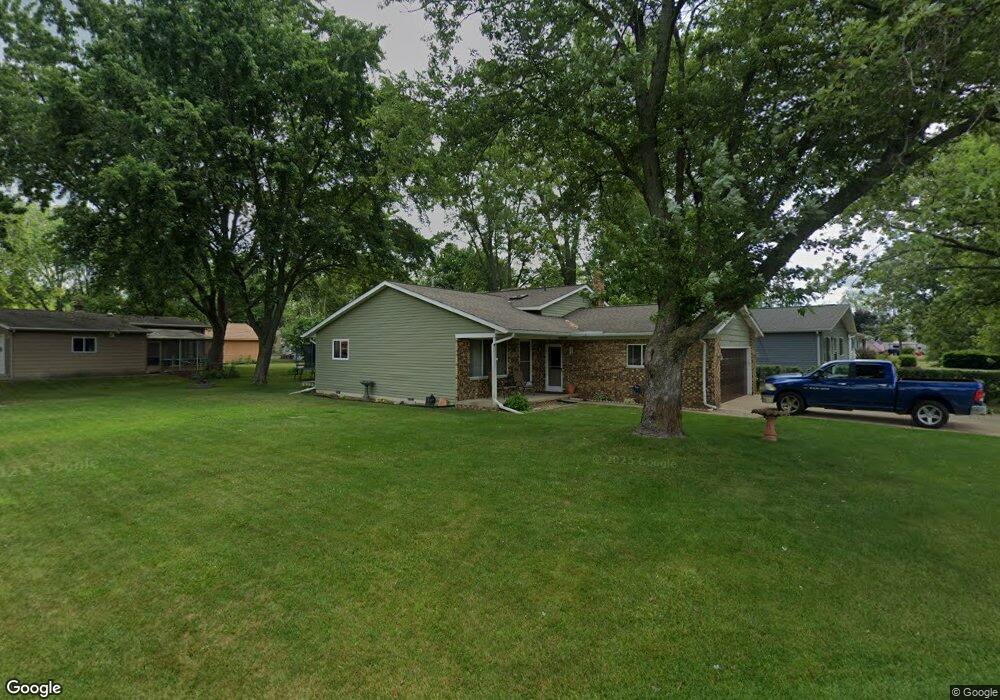
3374 W Clarice Ave Highland, MI 48356
Estimated Value: $330,081 - $398,000
3
Beds
2
Baths
1,772
Sq Ft
$206/Sq Ft
Est. Value
About This Home
This home is located at 3374 W Clarice Ave, Highland, MI 48356 and is currently estimated at $365,520, approximately $206 per square foot. 3374 W Clarice Ave is a home located in Oakland County with nearby schools including Brooks Elementary School.
Ownership History
Date
Name
Owned For
Owner Type
Purchase Details
Closed on
Feb 6, 2024
Sold by
Cooper Frank H and Cooper Karen L
Bought by
Mammel Christopher M and Mammel Natalie L
Current Estimated Value
Home Financials for this Owner
Home Financials are based on the most recent Mortgage that was taken out on this home.
Original Mortgage
$237,000
Outstanding Balance
$232,804
Interest Rate
6.6%
Mortgage Type
New Conventional
Estimated Equity
$132,716
Purchase Details
Closed on
Feb 27, 2012
Sold by
Cooper Ii Frank H and Cooper Karen L
Bought by
Cooper Frank H and Cooper Karen L
Purchase Details
Closed on
Apr 23, 1998
Sold by
Cooper Frank L
Bought by
Cooper Frank H
Home Financials for this Owner
Home Financials are based on the most recent Mortgage that was taken out on this home.
Original Mortgage
$87,000
Interest Rate
7.27%
Create a Home Valuation Report for This Property
The Home Valuation Report is an in-depth analysis detailing your home's value as well as a comparison with similar homes in the area
Home Values in the Area
Average Home Value in this Area
Purchase History
| Date | Buyer | Sale Price | Title Company |
|---|---|---|---|
| Mammel Christopher M | -- | None Listed On Document | |
| Cooper Frank H | -- | None Available | |
| Cooper Frank H | -- | -- |
Source: Public Records
Mortgage History
| Date | Status | Borrower | Loan Amount |
|---|---|---|---|
| Open | Mammel Christopher M | $237,000 | |
| Previous Owner | Cooper Frank H | $87,000 |
Source: Public Records
Tax History Compared to Growth
Tax History
| Year | Tax Paid | Tax Assessment Tax Assessment Total Assessment is a certain percentage of the fair market value that is determined by local assessors to be the total taxable value of land and additions on the property. | Land | Improvement |
|---|---|---|---|---|
| 2024 | $1,701 | $143,730 | $0 | $0 |
| 2023 | $1,622 | $136,450 | $0 | $0 |
| 2022 | $2,398 | $120,200 | $0 | $0 |
| 2021 | $2,275 | $113,220 | $0 | $0 |
| 2020 | $1,486 | $107,210 | $0 | $0 |
| 2019 | $2,211 | $102,410 | $0 | $0 |
| 2018 | $2,168 | $95,780 | $0 | $0 |
| 2017 | $2,080 | $95,780 | $0 | $0 |
| 2016 | $2,064 | $85,330 | $0 | $0 |
| 2015 | -- | $73,660 | $0 | $0 |
| 2014 | -- | $71,910 | $0 | $0 |
| 2011 | -- | $61,120 | $0 | $0 |
Source: Public Records
Map
Nearby Homes
- 1799 Elkridge Cir Unit 94
- 3831 Woodland Dr
- 2525 Davista Dr
- 3175 Oakridge Dr
- 2286 Davista Dr
- 2295 Davista Dr
- 2895 Golfers Dr
- 2935 Jackson Blvd
- 3292 Highland Blvd
- 3680 Jackson Blvd
- 3201 Lester Dr
- 3155 Ridge Rd
- 3522 Jackson Blvd
- 4335 Leroy Ct
- 4725 Hickory Dr
- 2300 Jackson Blvd
- 3453 Ormond Rd
- 2615 Ormond Rd
- 1739 Ridge Rd
- 1745 Ridge Rd
- 3402 W Clarice Ave
- 3342 W Clarice Ave
- 3412 W Clarice Ave
- 3328 W Clarice Ave
- 3411 Gadd Ct
- 3422 W Clarice Ave
- 3399 W Clarice Ave
- 3379 W Clarice Ave
- 0 W Clarice Ave
- 3389 W Clarice Ave Unit Bldg-Unit
- 3389 W Clarice Ave
- 3325 W Clarice Ave
- 3421 Gadd Ct
- 3329 W Clarice Ave
- 3413 W Clarice Ave
- 3323 W Clarice Ave
- 3321 W Clarice Ave
- 3442 W Clarice Ave
- 3317 W Clarice Ave
- 3433 Gadd Ct