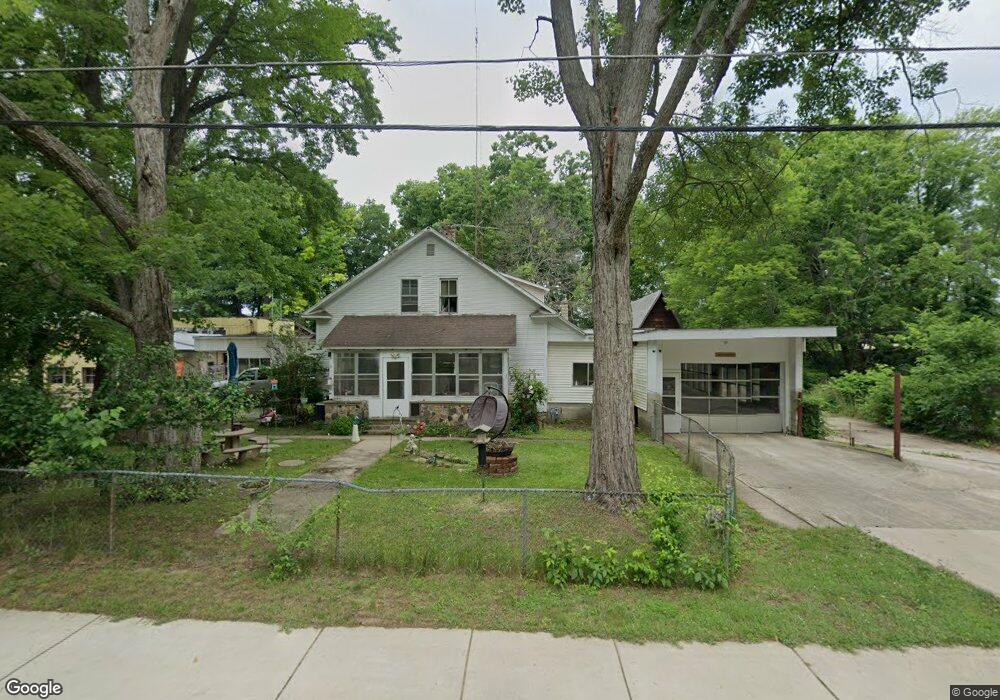
3375 115th Ave Allegan, MI 49010
Estimated Value: $305,000 - $633,000
--
Bed
--
Bath
6,026
Sq Ft
$77/Sq Ft
Est. Value
About This Home
This home is located at 3375 115th Ave, Allegan, MI 49010 and is currently estimated at $464,465, approximately $77 per square foot. 3375 115th Ave is a home located in Allegan County with nearby schools including West Ward Elementary School, L.E. White Middle School, and Allegan High School.
Ownership History
Date
Name
Owned For
Owner Type
Purchase Details
Closed on
Sep 30, 2021
Sold by
Arndt Gwendolyn and The Arline R Hiscock Revocable
Bought by
Hiscock David
Current Estimated Value
Purchase Details
Closed on
Sep 24, 2021
Sold by
Arndt Gwendolyn and Arline R Hiscock Revocable Trust
Bought by
Hiscock David
Purchase Details
Closed on
Aug 30, 2012
Sold by
Hiscock Arline R
Bought by
Hiscock Arline R
Purchase Details
Closed on
Oct 27, 2000
Sold by
Hiscock Robert
Bought by
Allegan Public Schools
Create a Home Valuation Report for This Property
The Home Valuation Report is an in-depth analysis detailing your home's value as well as a comparison with similar homes in the area
Home Values in the Area
Average Home Value in this Area
Purchase History
| Date | Buyer | Sale Price | Title Company |
|---|---|---|---|
| Hiscock David | -- | None Available | |
| Hiscock David | -- | None Listed On Document | |
| Hiscock Arline R | -- | None Available | |
| Hiscock Arline R | -- | None Available | |
| Allegan Public Schools | -- | -- |
Source: Public Records
Tax History Compared to Growth
Tax History
| Year | Tax Paid | Tax Assessment Tax Assessment Total Assessment is a certain percentage of the fair market value that is determined by local assessors to be the total taxable value of land and additions on the property. | Land | Improvement |
|---|---|---|---|---|
| 2025 | $5,453 | $139,800 | $81,100 | $58,700 |
| 2024 | $5,851 | $127,800 | $69,700 | $58,100 |
| 2023 | $5,851 | $101,300 | $48,800 | $52,500 |
| 2022 | $5,851 | $114,100 | $68,000 | $46,100 |
| 2021 | $2,254 | $85,100 | $37,700 | $47,400 |
| 2020 | $2,254 | $87,700 | $40,000 | $47,700 |
| 2019 | $0 | $84,900 | $37,900 | $47,000 |
| 2018 | $0 | $128,000 | $14,900 | $113,100 |
| 2017 | $0 | $115,300 | $13,700 | $101,600 |
| 2016 | $0 | $107,100 | $13,400 | $93,700 |
| 2015 | -- | $107,100 | $13,400 | $93,700 |
| 2014 | -- | $103,600 | $14,400 | $89,200 |
| 2013 | -- | $108,100 | $14,900 | $93,200 |
Source: Public Records
Map
Nearby Homes