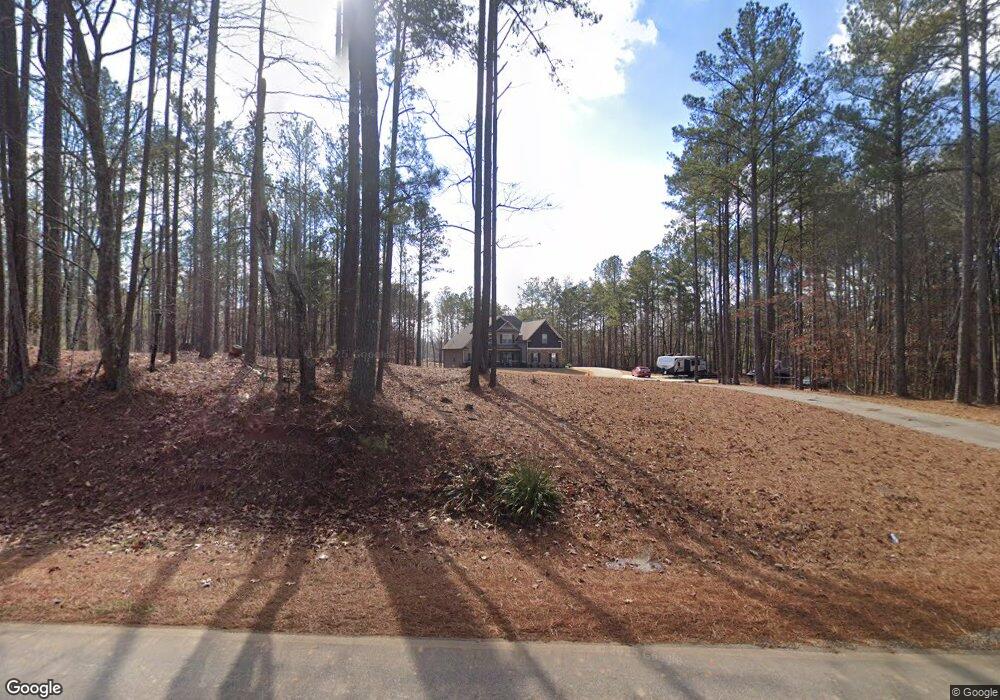
3375 Coppermine Rd Temple, GA 30179
Estimated Value: $579,633 - $650,000
3
Beds
3
Baths
2,605
Sq Ft
$236/Sq Ft
Est. Value
About This Home
This home is located at 3375 Coppermine Rd, Temple, GA 30179 and is currently estimated at $613,878, approximately $235 per square foot. 3375 Coppermine Rd is a home with nearby schools including Haralson County High School.
Ownership History
Date
Name
Owned For
Owner Type
Purchase Details
Closed on
Feb 6, 2017
Bought by
Patterson Shane and Patterson Jamie
Current Estimated Value
Home Financials for this Owner
Home Financials are based on the most recent Mortgage that was taken out on this home.
Original Mortgage
$275,886
Outstanding Balance
$222,046
Interest Rate
3.5%
Mortgage Type
FHA
Estimated Equity
$391,832
Purchase Details
Closed on
Jun 29, 2016
Sold by
Mcgarity Elizabeth R
Bought by
S & D Homes Llc
Home Financials for this Owner
Home Financials are based on the most recent Mortgage that was taken out on this home.
Original Mortgage
$175,000
Interest Rate
3.66%
Mortgage Type
New Conventional
Purchase Details
Closed on
Dec 22, 2015
Sold by
Mcgarity George T
Bought by
Mcgarity Elizabeth R
Purchase Details
Closed on
Dec 11, 2015
Sold by
Estavanko Richard A
Bought by
Mcgarity George T and Mcgarity Elizabeth R
Purchase Details
Closed on
Oct 4, 2000
Sold by
Huguley Kenneth J
Bought by
Estavanko Richard A
Purchase Details
Closed on
Nov 7, 1998
Bought by
Huguley Kenneth J
Create a Home Valuation Report for This Property
The Home Valuation Report is an in-depth analysis detailing your home's value as well as a comparison with similar homes in the area
Purchase History
| Date | Buyer | Sale Price | Title Company |
|---|---|---|---|
| Patterson Shane | $301,269 | -- | |
| S & D Homes Llc | $25,500 | -- | |
| Mcgarity Elizabeth R | -- | -- | |
| Mcgarity George T | $25,000 | -- | |
| Estavanko Richard A | $35,900 | -- | |
| Huguley Kenneth J | -- | -- |
Source: Public Records
Mortgage History
| Date | Status | Borrower | Loan Amount |
|---|---|---|---|
| Open | Patterson Shane | $275,886 | |
| Previous Owner | S & D Homes Llc | $175,000 |
Source: Public Records
Tax History
| Year | Tax Paid | Tax Assessment Tax Assessment Total Assessment is a certain percentage of the fair market value that is determined by local assessors to be the total taxable value of land and additions on the property. | Land | Improvement |
|---|---|---|---|---|
| 2025 | $5,439 | $190,178 | $6,400 | $183,778 |
| 2024 | $5,439 | $211,778 | $16,000 | $195,778 |
| 2023 | $5,561 | $209,399 | $15,000 | $194,399 |
| 2022 | $4,487 | $169,350 | $15,000 | $154,350 |
| 2021 | $4,448 | $161,222 | $15,000 | $146,222 |
| 2020 | $4,596 | $155,495 | $15,000 | $140,495 |
| 2019 | $2,058 | $72,622 | $15,000 | $57,622 |
| 2018 | $2,146 | $72,622 | $15,000 | $57,622 |
| 2017 | $2,020 | $65,894 | $15,000 | $50,894 |
| 2016 | $306 | $15,000 | $15,000 | $0 |
| 2015 | $460 | $15,000 | $15,000 | $0 |
| 2014 | $453 | $15,000 | $15,000 | $0 |
Source: Public Records
Map
Nearby Homes
- 0 Allgood Church Rd Unit 144628
- 0 Allgood Church Rd Unit 26324021
- 163 Golden Rd
- 295 Miller Path
- 342 Miller Path
- 56 Pleasant Forest Ct
- 35 Grove Ln
- 1035 Golden Rd
- 33 Tolbert Rd
- 0 Hutcheson Road Off
- 298 Randall Dr
- 3639 Holly Springs Rd
- 174 Randall Dr
- 300 Majesty Dr
- 61 Majesty Dr
- 1968 Allgood Church Rd
- 107 Chief Ct
- 1270 Mcgarity Rd
- 464 Pleasant Grove Rd
- 0 Hutcheson Rd Unit 10686409
- 3289 Coppermine Rd
- 3405 Coppermine Rd
- 3445 Coppermine Rd
- 3225 Coppermine Rd
- 3291 Coppermine Rd
- 3471 Coppermine Rd
- 3290 Coppermine Rd
- 3515 Coppermine Rd
- 3293 Coppermine Rd
- 3446 Coppermine Rd
- 3220 Coppermine Rd
- 363 Hutcheson Rd
- 3525 Coppermine Rd
- 3394 Coppermine Rd
- 3496 Coppermine Rd
- 3522 Coppermine Rd
- 3118 Coppermine Rd
- 3119 Coppermine Rd
- 3598 Coppermine Rd
- 3624 Coppermine Rd
Your Personal Tour Guide
Ask me questions while you tour the home.