


33757 S Davis Rd Reading, KS 66868
Estimated payment $5,788/month
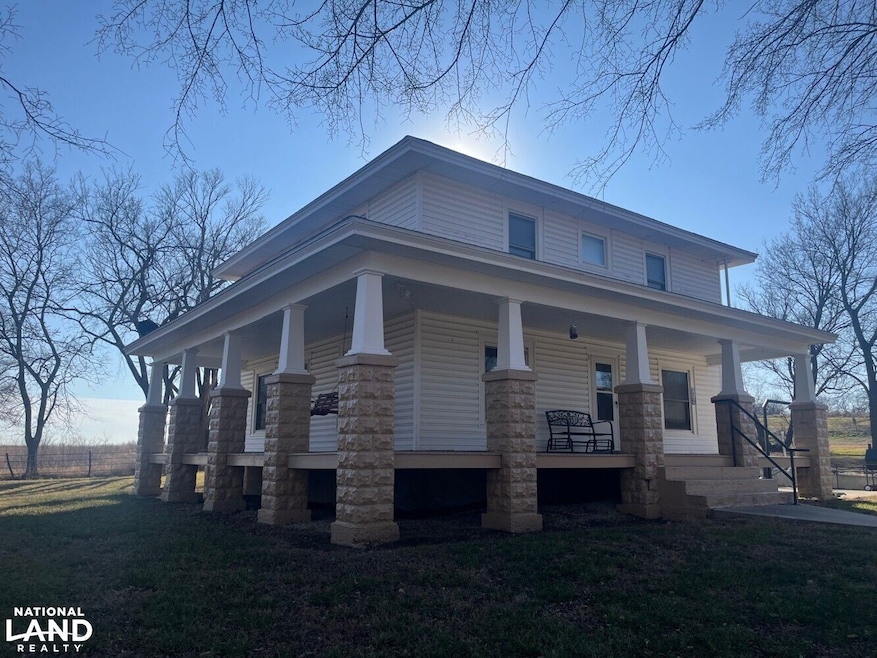
About This Lot
This 4-bedroom, 2.5 bath farmhouse sits off the road in a beautiful, secluded setting with great hunting habitat and proven success for deer and turkey hunting. This is a very nice home as a primary residence, with lots of money spent to renovate and update both the interior and exterior. It would also make for a cozy cabin or hunting camp, and plenty big enough for your whole family or a group of friends to bed down after the hunt. There is a neat old hay barn that greatly adds to the aesthetic of the property, plus another nice shop building for storage. The deer and turkey populations are in great shape, and you have all the habitat you'd ever want. The tillable acreage has been planted to seedling oaks and pecans, which will greatly add to the hunting cover and aesthetics of the property in the long run, or that field could certainly be farmed again. *Additional acreage is available; see other listings or contact broker for details.*

Property Details
Property Type
- Land
Est. Annual Taxes
- $4,714
Lot Details
- Current uses include hunting/fishing
Map
Home Values in the Area
Average Home Value in this Area
Tax History
| Year | Tax Paid | Tax Assessment Tax Assessment Total Assessment is a certain percentage of the fair market value that is determined by local assessors to be the total taxable value of land and additions on the property. | Land | Improvement |
|---|---|---|---|---|
| 2024 | $4,714 | $43,192 | $18,715 | $24,477 |
| 2023 | $4,965 | $43,293 | $19,873 | $23,420 |
| 2022 | -- | $39,700 | $19,543 | $20,157 |
| 2021 | $0 | $34,582 | $19,586 | $14,996 |
| 2020 | $4,300 | $33,925 | $18,932 | $14,993 |
| 2019 | $4,404 | $32,524 | $17,830 | $14,694 |
| 2018 | $4,237 | $31,643 | $17,933 | $13,710 |
| 2017 | $4,024 | $29,546 | $17,006 | $12,540 |
| 2016 | $3,787 | $28,023 | $15,818 | $12,205 |
| 2015 | -- | $26,751 | $14,162 | $12,589 |
| 2013 | $2,618 | $20,950 | $11,238 | $9,712 |
Property History
| Date | Event | Price | Change | Sq Ft Price |
|---|---|---|---|---|
| 07/05/2025 07/05/25 | For Sale | $975,000 | -51.1% | -- |
| 07/05/2025 07/05/25 | For Sale | $1,995,000 | -24.7% | -- |
| 07/05/2025 07/05/25 | For Sale | $2,650,000 | -24.3% | -- |
| 07/05/2025 07/05/25 | For Sale | $3,500,000 | +259.0% | -- |
| 06/29/2025 06/29/25 | Off Market | -- | -- | -- |
| 06/29/2025 06/29/25 | Off Market | -- | -- | -- |
| 06/29/2025 06/29/25 | Off Market | -- | -- | -- |
| 06/29/2025 06/29/25 | Off Market | -- | -- | -- |
| 03/25/2025 03/25/25 | For Sale | $975,000 | -51.1% | -- |
| 02/04/2025 02/04/25 | For Sale | $1,995,000 | -43.0% | -- |
| 02/04/2025 02/04/25 | For Sale | $3,500,000 | +32.1% | -- |
| 02/04/2025 02/04/25 | For Sale | $2,650,000 | -- | -- |
- 2740 Dobbin Terrace
- 520 N Kansas St
- 214 W 5th St
- 209 W 5th St
- 310 E 4th St
- 209 S Elm St
- 213 S Elm St
- 0 25th Rd
- 2016 Road 170
- W 325th St
- 00000 S Indian Hills Rd
- 1743 Road 175
- 2667 Road V
- 8218 W 273rd Terrace
- 8218 W 273rd St
- 1800 Road R
- 109 W Maple Ave
- 111 Merchant St
- 0 Park Ave Unit HMS2560137
- 315 E Park Ave