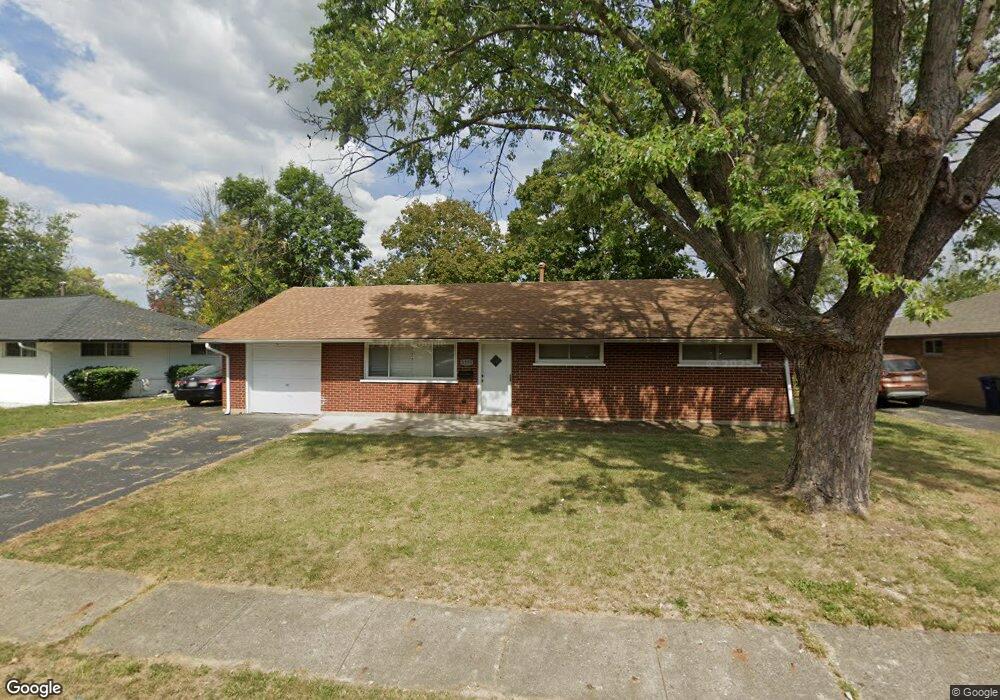
3378 Stephen Dr S Columbus, OH 43204
Southwest Hilltop NeighborhoodEstimated Value: $210,000 - $236,000
3
Beds
2
Baths
1,080
Sq Ft
$205/Sq Ft
Est. Value
About This Home
This home is located at 3378 Stephen Dr S, Columbus, OH 43204 and is currently estimated at $221,879, approximately $205 per square foot. 3378 Stephen Dr S is a home located in Franklin County with nearby schools including Binns Elementary School, Wedgewood Middle School, and Briggs High School.
Ownership History
Date
Name
Owned For
Owner Type
Purchase Details
Closed on
Aug 28, 2020
Sold by
Halderman Kelley
Bought by
Montgomery Kimberly
Current Estimated Value
Home Financials for this Owner
Home Financials are based on the most recent Mortgage that was taken out on this home.
Original Mortgage
$153,900
Outstanding Balance
$136,827
Interest Rate
3%
Mortgage Type
New Conventional
Estimated Equity
$85,052
Purchase Details
Closed on
Mar 29, 2019
Sold by
Dixon Larry Nathan
Bought by
Halderman Kelley
Home Financials for this Owner
Home Financials are based on the most recent Mortgage that was taken out on this home.
Original Mortgage
$131,800
Interest Rate
4.3%
Mortgage Type
New Conventional
Purchase Details
Closed on
Oct 21, 2016
Sold by
Dixon Larry Nathan and Bernice Dixon Revocable Trust
Bought by
Dixon Larry Nathan
Purchase Details
Closed on
Jul 10, 2007
Sold by
Dixon Bernice C and Dixon Robert Lowry
Bought by
Revoca Dixon Bernice Catherine and Revoca Bernice Catherine Dixon
Purchase Details
Closed on
Jun 17, 2005
Sold by
Zeirott Theodore J and Estate Of Amizetta N Mcgrath
Bought by
Dixon Bernice C
Create a Home Valuation Report for This Property
The Home Valuation Report is an in-depth analysis detailing your home's value as well as a comparison with similar homes in the area
Home Values in the Area
Average Home Value in this Area
Purchase History
| Date | Buyer | Sale Price | Title Company |
|---|---|---|---|
| Montgomery Kimberly | $164,900 | World Class Title | |
| Halderman Kelley | $141,800 | None Available | |
| Dixon Larry Nathan | -- | None Available | |
| Revoca Dixon Bernice Catherine | -- | Warranty Ti | |
| Dixon Bernice C | $78,000 | Title First |
Source: Public Records
Mortgage History
| Date | Status | Borrower | Loan Amount |
|---|---|---|---|
| Open | Montgomery Kimberly | $153,900 | |
| Previous Owner | Halderman Kelley | $131,800 |
Source: Public Records
Tax History Compared to Growth
Tax History
| Year | Tax Paid | Tax Assessment Tax Assessment Total Assessment is a certain percentage of the fair market value that is determined by local assessors to be the total taxable value of land and additions on the property. | Land | Improvement |
|---|---|---|---|---|
| 2024 | $2,936 | $62,270 | $15,160 | $47,110 |
| 2023 | $2,604 | $53,350 | $15,160 | $38,190 |
| 2022 | $2,820 | $53,070 | $8,580 | $44,490 |
| 2021 | $2,790 | $53,070 | $8,580 | $44,490 |
| 2020 | $1,794 | $34,480 | $8,580 | $25,900 |
| 2019 | $1,772 | $28,490 | $7,140 | $21,350 |
| 2018 | $1,714 | $28,490 | $7,140 | $21,350 |
| 2017 | $1,719 | $28,490 | $7,140 | $21,350 |
| 2016 | $1,616 | $24,400 | $4,870 | $19,530 |
| 2015 | $1,509 | $24,400 | $4,870 | $19,530 |
| 2014 | $1,513 | $24,400 | $4,870 | $19,530 |
| 2013 | $879 | $28,735 | $5,740 | $22,995 |
Source: Public Records
Map
Nearby Homes
- 3318 Miriam Dr S
- 3360 Briggs Rd
- 1027 S Brinker Ave
- 840 Mark Place
- 3551 Glorious Rd
- 781 Stephen Dr W
- 1226 Pinnacle Dr
- 1243 Trevor Ct
- 737 S Brinker Ave
- 1181 Onslow Dr
- 695 Demorest Rd
- 756 Brixham Rd
- 894 Binns Blvd
- 3029 Rosedale Ave
- 1037 Chestershire Rd
- 617 Athens St
- 828 Binns Blvd
- 793 Binns Blvd
- 3727-3729 Briggs Rd
- 890 S Roys Ave
- 3378 S Stephen Dr
- 3386 Stephen Dr S
- 3370 Stephen Dr S
- 3386 S Stephen Dr
- 3355 Miriam Dr S
- 3392 Stephen Dr S
- 3360 Stephen Dr S
- 3361 Miriam Dr S
- 3347 Miriam Dr S
- 3381 Stephen Dr S
- 3375 Stephen Dr S
- 948 Stephen Dr W
- 3393 Stephen Dr S
- 3352 Stephen Dr S
- 929 Miriam Dr W
- 3387 Stephen Dr S
- 3367 Stephen Dr S
- 3337 Miriam Dr S
- 3407 Michael Ct
- 3361 Stephen Dr S