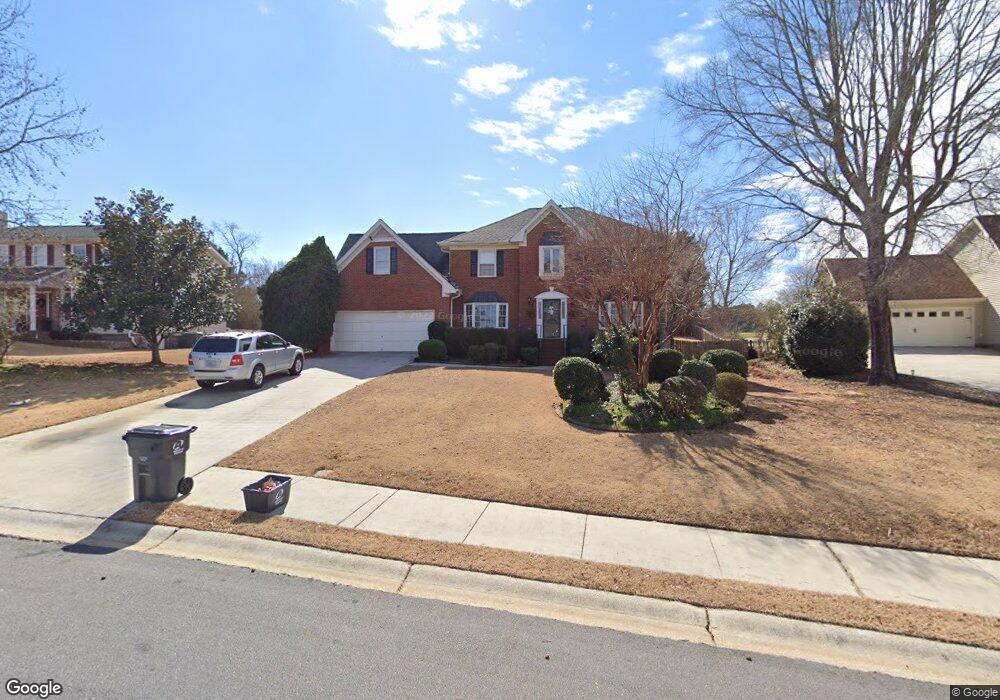
3379 Summit Turf Ln Snellville, GA 30078
Estimated Value: $390,000 - $447,000
3
Beds
3
Baths
2,577
Sq Ft
$160/Sq Ft
Est. Value
About This Home
This home is located at 3379 Summit Turf Ln, Snellville, GA 30078 and is currently estimated at $412,690, approximately $160 per square foot. 3379 Summit Turf Ln is a home located in Gwinnett County with nearby schools including Magill Elementary School, Grace Snell Middle School, and South Gwinnett High School.
Ownership History
Date
Name
Owned For
Owner Type
Purchase Details
Closed on
Dec 1, 2005
Sold by
Wisner Terry L and Wisner Carol
Bought by
Pankova Nadezhda A
Current Estimated Value
Home Financials for this Owner
Home Financials are based on the most recent Mortgage that was taken out on this home.
Original Mortgage
$24,500
Outstanding Balance
$13,504
Interest Rate
6.04%
Mortgage Type
Unknown
Estimated Equity
$399,186
Purchase Details
Closed on
Jun 15, 2001
Sold by
Britt Chris B and Britt Kay H
Bought by
Wisner Terry L
Home Financials for this Owner
Home Financials are based on the most recent Mortgage that was taken out on this home.
Original Mortgage
$156,000
Interest Rate
7.11%
Mortgage Type
New Conventional
Purchase Details
Closed on
Aug 4, 1998
Sold by
Ard Horace B and Ard Betty H
Bought by
Britt Chris
Home Financials for this Owner
Home Financials are based on the most recent Mortgage that was taken out on this home.
Original Mortgage
$100,000
Interest Rate
6.97%
Mortgage Type
New Conventional
Create a Home Valuation Report for This Property
The Home Valuation Report is an in-depth analysis detailing your home's value as well as a comparison with similar homes in the area
Home Values in the Area
Average Home Value in this Area
Purchase History
| Date | Buyer | Sale Price | Title Company |
|---|---|---|---|
| Pankova Nadezhda A | $245,000 | -- | |
| Wisner Terry L | $195,000 | -- | |
| Britt Chris | $157,000 | -- |
Source: Public Records
Mortgage History
| Date | Status | Borrower | Loan Amount |
|---|---|---|---|
| Open | Pankova Nadezhda A | $24,500 | |
| Open | Pankova Nadezhda A | $196,000 | |
| Previous Owner | Wisner Terry L | $156,000 | |
| Previous Owner | Britt Chris | $100,000 |
Source: Public Records
Tax History Compared to Growth
Tax History
| Year | Tax Paid | Tax Assessment Tax Assessment Total Assessment is a certain percentage of the fair market value that is determined by local assessors to be the total taxable value of land and additions on the property. | Land | Improvement |
|---|---|---|---|---|
| 2024 | $3,853 | $149,880 | $30,000 | $119,880 |
| 2023 | $3,853 | $159,760 | $29,680 | $130,080 |
| 2022 | $3,738 | $143,640 | $22,000 | $121,640 |
| 2021 | $2,844 | $97,120 | $14,000 | $83,120 |
| 2020 | $3,386 | $97,120 | $14,000 | $83,120 |
| 2019 | $3,379 | $97,120 | $14,000 | $83,120 |
| 2018 | $3,383 | $96,720 | $12,000 | $84,720 |
| 2016 | $3,072 | $84,920 | $10,000 | $74,920 |
| 2015 | $2,955 | $81,680 | $10,000 | $71,680 |
| 2014 | -- | $81,680 | $10,000 | $71,680 |
Source: Public Records
Map
Nearby Homes
- 3348 Summit Turf Ln Unit 2
- 3819 Tielman St
- 3772 Tielman St
- 3792 Tielman St
- The Wesley Plan at Soleil at Summit Chase - Summit Chase
- The Weston Plan at Soleil at Summit Chase - Summit Chase
- The Denton Plan at Soleil at Summit Chase - Summit Chase
- The Jefferson Plan at Soleil at Summit Chase - Summit Chase
- The Auburn Plan at Soleil at Summit Chase - Summit Chase
- The Pearson Plan at Soleil at Summit Chase - Summit Chase
- The Montrose Plan at Soleil at Summit Chase - Summit Chase
- The Edison Plan at Soleil at Summit Chase - Summit Chase
- The Tifton Plan at Soleil at Summit Chase - Summit Chase
- 1292 Green Turf Dr
- 3315 Linstead Ct Unit 2A
- 3315 Linstead Ct
- 996 Lakeview Oaks Ct Unit 25-B
- 996 Lakeview Oaks Ct
- 3157 Brooks Dr
- 3142 Brooks Dr
- 3369 Summit Turf Ln
- 3389 Summit Turf Ln
- 3359 Summit Turf Ln
- 3399 Summit Turf Ln Unit 2
- 0 Summit Turf Ln Unit 7363521
- 0 Summit Turf Ln Unit 8463991
- 0 Summit Turf Ln Unit 8373455
- 0 Summit Turf Ln Unit 8388861
- 0 Summit Turf Ln
- 3378 Summit Turf Ln Unit 2
- 3388 Summit Turf Ln
- 3368 Summit Turf Ln
- 3349 Summit Turf Ln
- 3398 Summit Turf Ln
- 3358 Summit Turf Ln
- 0 Rosebud Rd Unit 2943757
- 0 Rosebud Rd Unit 7066488
- 0000 Rosebud Rd
- 0 Rosebud Rd Unit 5.0 5122261
- 3339 Summit Turf Ln