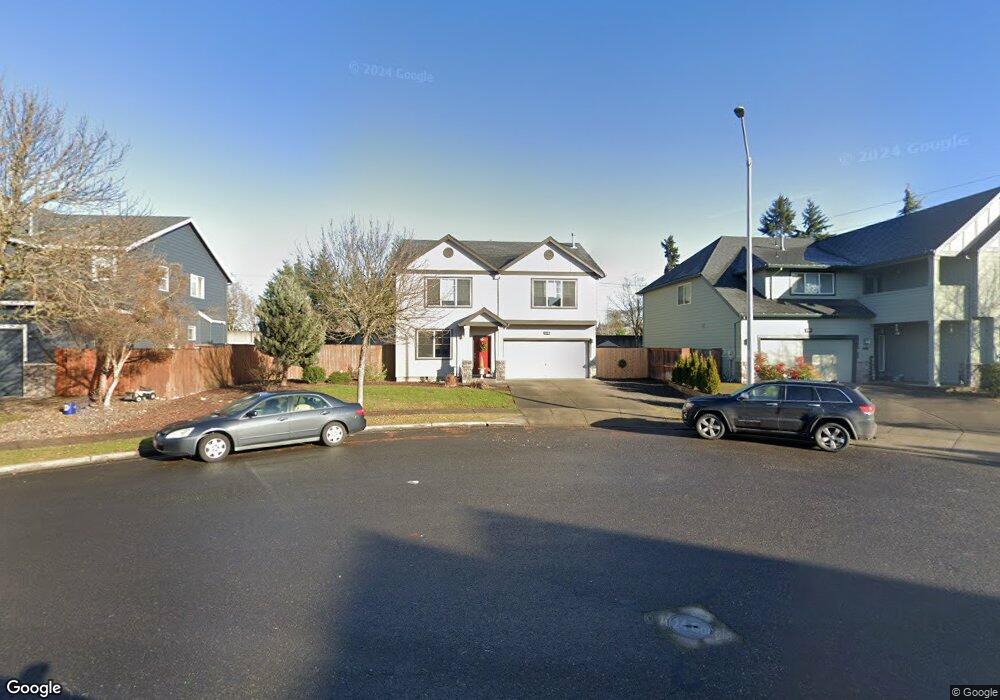
33791 NE Kern Ct Scappoose, OR 97056
Estimated Value: $505,000 - $550,000
4
Beds
3
Baths
2,196
Sq Ft
$238/Sq Ft
Est. Value
About This Home
This home is located at 33791 NE Kern Ct, Scappoose, OR 97056 and is currently estimated at $522,808, approximately $238 per square foot. 33791 NE Kern Ct is a home located in Columbia County with nearby schools including Scappoose High School, South Columbia Family School, and Scappoose Adventist School.
Ownership History
Date
Name
Owned For
Owner Type
Purchase Details
Closed on
Jun 28, 2017
Sold by
Brooks Trevor and Granger Mattie L
Bought by
Olaes Priscilla C and Granger Mattie L
Current Estimated Value
Purchase Details
Closed on
Jun 18, 2009
Sold by
Brooks Mattie and Granger Mattie
Bought by
Brooks Trevor and Brooks Mattie
Home Financials for this Owner
Home Financials are based on the most recent Mortgage that was taken out on this home.
Original Mortgage
$211,600
Outstanding Balance
$132,901
Interest Rate
4.82%
Mortgage Type
New Conventional
Estimated Equity
$389,907
Purchase Details
Closed on
Jan 8, 2008
Sold by
Buena Vista Custom Homes Inc
Bought by
Brooks Trevor and Granger Mattie
Home Financials for this Owner
Home Financials are based on the most recent Mortgage that was taken out on this home.
Original Mortgage
$231,300
Interest Rate
6.05%
Mortgage Type
Unknown
Create a Home Valuation Report for This Property
The Home Valuation Report is an in-depth analysis detailing your home's value as well as a comparison with similar homes in the area
Home Values in the Area
Average Home Value in this Area
Purchase History
| Date | Buyer | Sale Price | Title Company |
|---|---|---|---|
| Olaes Priscilla C | $190,000 | Ticor Title Company Of Or | |
| Brooks Trevor | -- | Columbia County Title | |
| Brooks Trevor | $243,500 | First Amer Title Ins Co Or |
Source: Public Records
Mortgage History
| Date | Status | Borrower | Loan Amount |
|---|---|---|---|
| Open | Brooks Trevor | $211,600 | |
| Closed | Brooks Trevor | $231,300 |
Source: Public Records
Tax History Compared to Growth
Tax History
| Year | Tax Paid | Tax Assessment Tax Assessment Total Assessment is a certain percentage of the fair market value that is determined by local assessors to be the total taxable value of land and additions on the property. | Land | Improvement |
|---|---|---|---|---|
| 2025 | $4,375 | $265,700 | $82,740 | $182,960 |
| 2024 | $4,254 | $257,970 | $80,330 | $177,640 |
| 2023 | $4,214 | $250,460 | $83,840 | $166,620 |
| 2022 | $4,036 | $243,170 | $80,840 | $162,330 |
| 2021 | $3,921 | $236,090 | $82,890 | $153,200 |
| 2020 | $3,637 | $229,220 | $83,910 | $145,310 |
| 2019 | $3,542 | $222,550 | $80,680 | $141,870 |
| 2018 | $3,461 | $216,070 | $82,090 | $133,980 |
| 2017 | $3,399 | $209,780 | $79,700 | $130,080 |
| 2016 | $3,355 | $203,670 | $77,380 | $126,290 |
| 2015 | $3,186 | $197,740 | $65,230 | $132,510 |
| 2014 | $3,105 | $191,990 | $49,840 | $142,150 |
Source: Public Records
Map
Nearby Homes
- 52866 NE 2nd St
- 51587 SE Oak St
- 51425 SE Oak St Unit 65
- 33374 Wickstrom Dr
- 33399 NW Ej Smith Rd
- 52256 SE 6th Ct
- 53194 Columbia River Hwy
- 52269 SE Tyler St
- 52171 Casswell Dr
- 52238 Teakwood Dr
- 52144 SE 8th St
- 52407 NE 14th St
- 32952 NW Ridge Dr
- 51925 Columbia River Hwy
- 33062 Bellcrest Rd
- 32904 NW View Terrace Place
- 33375 SW Rokin Way
- 33363 SW Rokin Way
- 33374 SW Rokin Way
- 33358 SW Rokin Way
- 33787 NE Kern Ct
- 33795 NE Kern Ct
- 33803 NE Kern Ct
- 33780 NE Kern Ct
- 33772 NE Kern Ct
- 33800 NE Kern Ct
- 33790 NE Kern Ct
- 33796 NE Kern Ct
- 33784 NE Kern Ct
- 52763 NE Porter Ln
- 52720 NE Porter Ln
- 52728 NE Porter Ln
- 33787 NE Erin Dr
- 33791 NE Erin Dr
- 52757 NE Porter Ln
- 52724 W Lane Rd
- 33797 NE Erin Dr
- 52683 Sheena Place
- 52704 W Lane Rd
- 52733 NE Porter Ln