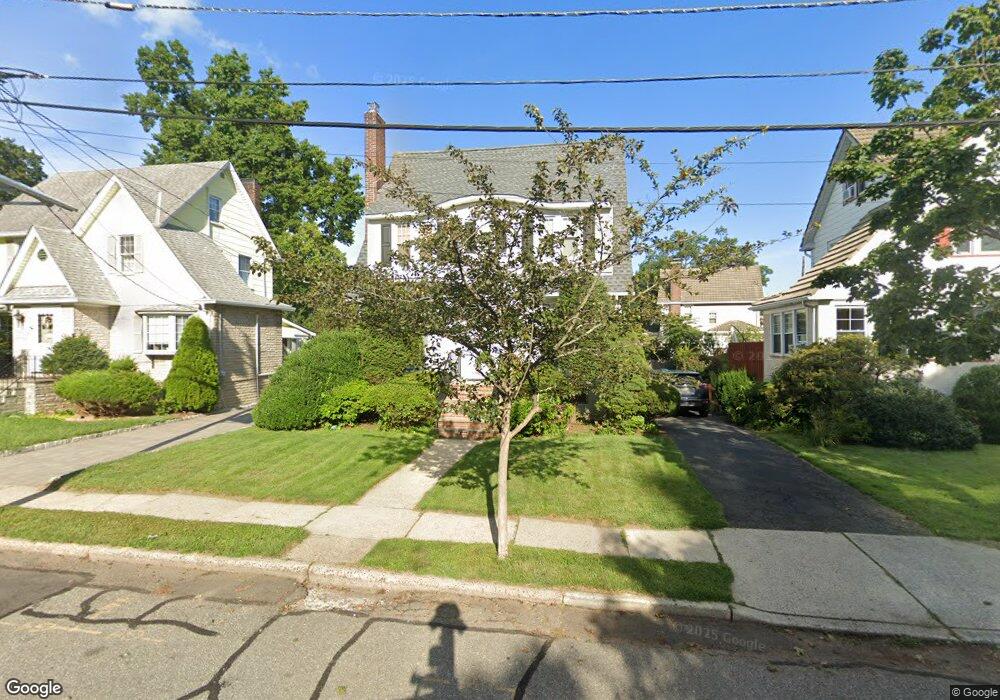
338 Demarest Ave Oradell, NJ 07649
Estimated Value: $672,681 - $786,000
3
Beds
1
Bath
1,480
Sq Ft
$507/Sq Ft
Est. Value
About This Home
This home is located at 338 Demarest Ave, Oradell, NJ 07649 and is currently estimated at $750,670, approximately $507 per square foot. 338 Demarest Ave is a home located in Bergen County with nearby schools including Oradell Elementary School, River Dell Middle School, and River Dell Regional High School.
Ownership History
Date
Name
Owned For
Owner Type
Purchase Details
Closed on
Aug 4, 2021
Sold by
Groarke John and Groarke Madeline A
Bought by
Sansanelli Brian and Sansanelli Marcela
Current Estimated Value
Home Financials for this Owner
Home Financials are based on the most recent Mortgage that was taken out on this home.
Original Mortgage
$465,500
Outstanding Balance
$423,284
Interest Rate
2.9%
Mortgage Type
New Conventional
Estimated Equity
$327,386
Create a Home Valuation Report for This Property
The Home Valuation Report is an in-depth analysis detailing your home's value as well as a comparison with similar homes in the area
Home Values in the Area
Average Home Value in this Area
Purchase History
| Date | Buyer | Sale Price | Title Company |
|---|---|---|---|
| Sansanelli Brian | $490,000 | Titlemark Llc |
Source: Public Records
Mortgage History
| Date | Status | Borrower | Loan Amount |
|---|---|---|---|
| Open | Sansanelli Brian | $465,500 |
Source: Public Records
Tax History
| Year | Tax Paid | Tax Assessment Tax Assessment Total Assessment is a certain percentage of the fair market value that is determined by local assessors to be the total taxable value of land and additions on the property. | Land | Improvement |
|---|---|---|---|---|
| 2025 | $12,192 | $504,800 | $276,000 | $228,800 |
| 2024 | $11,897 | $447,900 | $244,700 | $203,200 |
| 2023 | $11,378 | $445,900 | $243,700 | $202,200 |
| 2022 | $11,378 | $425,500 | $233,700 | $191,800 |
| 2021 | $10,437 | $373,300 | $211,500 | $161,800 |
| 2020 | $9,845 | $356,300 | $195,500 | $160,800 |
| 2019 | $9,757 | $350,200 | $192,500 | $157,700 |
| 2018 | $9,338 | $340,200 | $184,500 | $155,700 |
| 2017 | $9,027 | $334,100 | $181,500 | $152,600 |
| 2016 | $8,714 | $292,800 | $172,000 | $120,800 |
| 2015 | $8,523 | $292,800 | $172,000 | $120,800 |
| 2014 | $8,152 | $292,800 | $172,000 | $120,800 |
Source: Public Records
Map
Nearby Homes
Your Personal Tour Guide
Ask me questions while you tour the home.