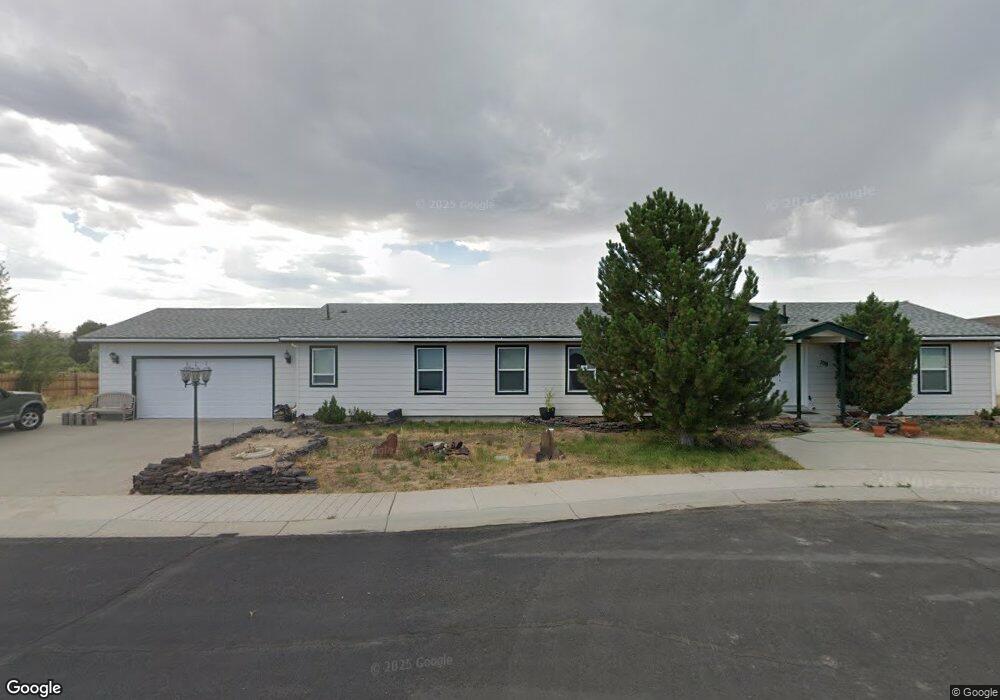
338 Double Down Cir Jackpot, NV 89825
Estimated Value: $269,000 - $404,000
Studio
--
Bath
2,052
Sq Ft
$174/Sq Ft
Est. Value
About This Home
This home is located at 338 Double Down Cir, Jackpot, NV 89825 and is currently estimated at $356,723, approximately $173 per square foot. 338 Double Down Cir is a home with nearby schools including Jackpot Elementary School, Jackpot Junior High School, and Jackpot High School.
Ownership History
Date
Name
Owned For
Owner Type
Purchase Details
Closed on
Aug 19, 2020
Sold by
Bruce Ririe Melvin and Bruce Saradel
Bought by
Ririe Melvin Bruce and Ririe Saradel
Current Estimated Value
Home Financials for this Owner
Home Financials are based on the most recent Mortgage that was taken out on this home.
Original Mortgage
$137,600
Outstanding Balance
$97,704
Interest Rate
3%
Mortgage Type
New Conventional
Estimated Equity
$259,019
Purchase Details
Closed on
May 30, 2019
Sold by
Walters Alton Joseph and Walters Sandra Lee
Bought by
Ririe Melvin B and Ririe Saradel
Home Financials for this Owner
Home Financials are based on the most recent Mortgage that was taken out on this home.
Original Mortgage
$135,200
Interest Rate
4.1%
Mortgage Type
New Conventional
Purchase Details
Closed on
Jan 9, 2007
Sold by
Federal Home Loan Mortgage Corporation
Bought by
Walter A Joseph
Purchase Details
Closed on
Sep 28, 2006
Sold by
Wells Fargo Bank Na
Bought by
Federal Home Loan Mortgage Corporation
Create a Home Valuation Report for This Property
The Home Valuation Report is an in-depth analysis detailing your home's value as well as a comparison with similar homes in the area
Purchase History
| Date | Buyer | Sale Price | Title Company |
|---|---|---|---|
| Ririe Melvin Bruce | $37,000 | Wfg National Title | |
| Ririe Melvin B | $169,000 | Wfg National Title | |
| Walter A Joseph | $159,900 | Service Link | |
| Federal Home Loan Mortgage Corporation | -- | First American Title | |
| Wells Fargo Bank Na | $120,000 | First American Title |
Source: Public Records
Mortgage History
| Date | Status | Borrower | Loan Amount |
|---|---|---|---|
| Open | Ririe Melvin Bruce | $137,600 | |
| Previous Owner | Ririe Melvin B | $135,200 |
Source: Public Records
Tax History
| Year | Tax Paid | Tax Assessment Tax Assessment Total Assessment is a certain percentage of the fair market value that is determined by local assessors to be the total taxable value of land and additions on the property. | Land | Improvement |
|---|---|---|---|---|
| 2025 | $2,756 | $86,183 | $16,450 | $69,733 |
| 2024 | $2,756 | $87,137 | $16,450 | $70,687 |
| 2023 | $2,474 | $82,691 | $16,450 | $66,241 |
| 2022 | $2,291 | $72,440 | $16,450 | $55,990 |
| 2021 | $2,494 | $70,240 | $16,450 | $53,790 |
| 2020 | $2,370 | $70,675 | $16,450 | $54,225 |
| 2019 | $2,288 | $68,145 | $16,450 | $51,695 |
| 2018 | $2,288 | $68,352 | $16,450 | $51,902 |
| 2017 | $2,083 | $67,233 | $16,450 | $50,783 |
| 2016 | $2,006 | $66,394 | $16,450 | $49,944 |
| 2015 | $1,948 | $65,492 | $16,450 | $49,042 |
| 2014 | $1,891 | $63,189 | $16,450 | $46,739 |
Source: Public Records
Map
Nearby Homes
- 0 Double Down Cir
- 0 Pinochle St
- 387 Lady Luck Dr
- 1081 N US Hwy Hwy
- 3056 Monte Carlo Dr
- 2279 Gurley Dr
- 0 Royal Dr
- 0 U S 93
- 0 Glendoren Dr
- 0 Glen Doren Unit 3627198
- MINERAL Hot Springs Hwy Unit 93
- 0 4th Idaho Unit 3627652
- 1516 N 2290 E
- 1512 N 2272 E
- 1521 N 2284 E
- TBD Kimberly Rd
- 2040 E 2200 N
- 2436B Oakley Ave
- TBD Oakley Ave
- 332 Double Down Cir
- 356 Double Down Cir
- 324 Double Down Cir
- 314 Double Down Cir
- 391 Double Down Cir
- 368 Double Down Cir
- 327 Lady Luck Dr
- 390 Double Down Cir
- 2735 Monte Carlo Dr
- 2769 Monte Carlo Dr
- 2768 Monte Carlo Dr
- 0 Royal Flush Dr Dr Unit 3626421
- 0 Royal Flush Dr Dr Unit 3616745
- 0 Sec 1 Twp 47n Rge 64e Mdb&m Unit 3616743
- 0 Sec 1 Twp 47n Rge 64e Mdb&m Unit 3616744
- 2793 Monte Carlo Dr
- 2805 Monte Carlo Dr
- 2829 Monte Carlo Dr
- 286 Bacarrat Ct
- 2851 Monte Carlo Dr
Your Personal Tour Guide
Ask me questions while you tour the home.