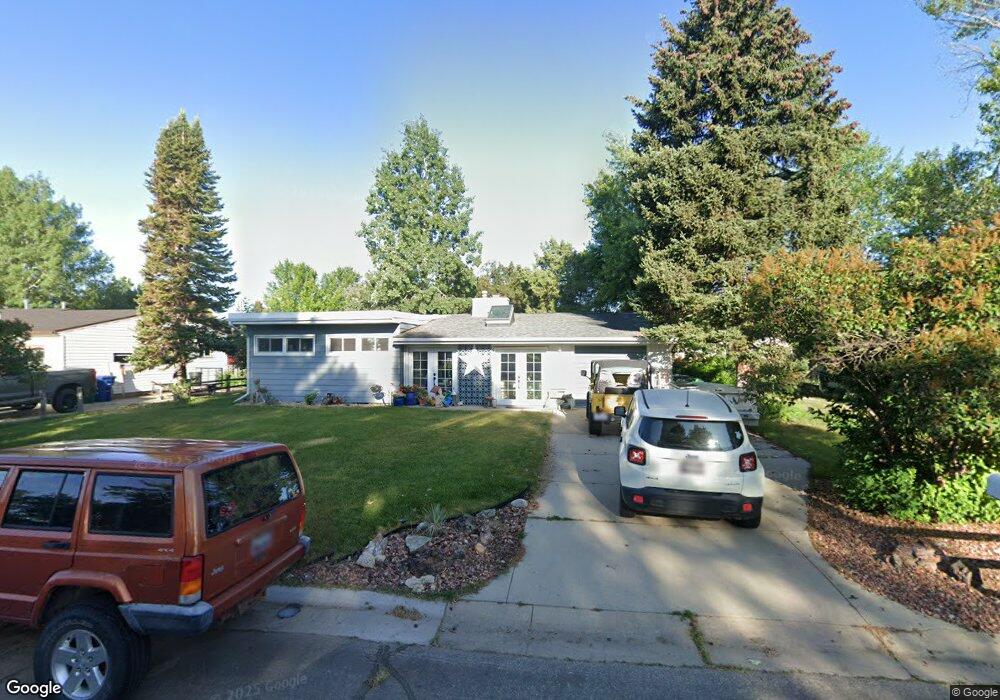
338 E Mountain View Dr Sheridan, WY 82801
Estimated Value: $343,997 - $409,000
4
Beds
2
Baths
1,287
Sq Ft
$289/Sq Ft
Est. Value
About This Home
This home is located at 338 E Mountain View Dr, Sheridan, WY 82801 and is currently estimated at $371,749, approximately $288 per square foot. 338 E Mountain View Dr is a home with nearby schools including Sheridan High School and Martin Luther Grammar School.
Ownership History
Date
Name
Owned For
Owner Type
Purchase Details
Closed on
Feb 24, 2022
Sold by
Doerr Gary T
Bought by
Straight Timothy Lee and Straight Daisy Michelle
Current Estimated Value
Home Financials for this Owner
Home Financials are based on the most recent Mortgage that was taken out on this home.
Original Mortgage
$140,000
Outstanding Balance
$122,078
Interest Rate
3.55%
Mortgage Type
New Conventional
Estimated Equity
$249,671
Purchase Details
Closed on
Feb 22, 2022
Sold by
Elevated Home Solutions Llc
Bought by
Butler Properties Llc
Home Financials for this Owner
Home Financials are based on the most recent Mortgage that was taken out on this home.
Original Mortgage
$140,000
Outstanding Balance
$122,078
Interest Rate
3.55%
Mortgage Type
New Conventional
Estimated Equity
$249,671
Purchase Details
Closed on
Dec 13, 2021
Sold by
John And Audrey Doerr Trust
Bought by
Doerr Gary T and Miller Shelley
Create a Home Valuation Report for This Property
The Home Valuation Report is an in-depth analysis detailing your home's value as well as a comparison with similar homes in the area
Home Values in the Area
Average Home Value in this Area
Purchase History
| Date | Buyer | Sale Price | Title Company |
|---|---|---|---|
| Straight Timothy Lee | -- | None Listed On Document | |
| Butler Properties Llc | -- | None Listed On Document | |
| Doerr Gary T | -- | None Listed On Document |
Source: Public Records
Mortgage History
| Date | Status | Borrower | Loan Amount |
|---|---|---|---|
| Open | Straight Timothy Lee | $140,000 | |
| Closed | Butler Properties Llc | $86,250 |
Source: Public Records
Tax History Compared to Growth
Tax History
| Year | Tax Paid | Tax Assessment Tax Assessment Total Assessment is a certain percentage of the fair market value that is determined by local assessors to be the total taxable value of land and additions on the property. | Land | Improvement |
|---|---|---|---|---|
| 2025 | $1,832 | $19,562 | $5,872 | $13,690 |
| 2024 | $1,832 | $25,616 | $7,528 | $18,088 |
| 2023 | $1,734 | $24,245 | $6,458 | $17,787 |
| 2022 | $1,527 | $21,350 | $5,832 | $15,518 |
| 2021 | $1,131 | $18,823 | $6,200 | $12,623 |
| 2020 | $1,043 | $17,583 | $5,543 | $12,040 |
| 2019 | $1,020 | $17,264 | $5,543 | $11,721 |
| 2018 | $950 | $16,281 | $5,442 | $10,839 |
| 2017 | $878 | $15,282 | $4,936 | $10,346 |
| 2015 | $840 | $14,755 | $4,443 | $10,312 |
| 2014 | $898 | $15,559 | $4,241 | $11,318 |
| 2013 | -- | $15,140 | $3,659 | $11,481 |
Source: Public Records
Map
Nearby Homes
- 1313 Victoria St
- 556 Old Course Way
- 1467 Lewis St
- 1324 Lewis St
- 0 Sunrise Unit 25-1146
- 1290 Burton St Unit D
- 1301 Avon St Unit B
- 40 Sunrise Ln
- 0 Meadowlark Ln
- TBD Fairway Ct
- 36 N Elk St
- 905 W Works St
- 0 Avon St
- 1703 Park Side Ct
- 2123 Excalibur Way Unit (HB-3)
- 924 Avon St
- 2161 Excalibur Way Unit (HB-6)
- 2214 Excalibur Way Unit (HB-33)
- 724 Lancelot St Unit (HB-55)
- 2240 Excalibur Way Unit (HB-31)
- 354 E Mountain View Dr
- 322 E Mountain View Dr
- 308 E Mountain View Dr
- 331 E Mountain View Dr
- 333 1st Pkwy W
- 355 E Mountain View Dr
- 353 1st West Pkwy
- 323 1st West Pkwy
- 307 E Mountain View Dr
- 246 E Mountain View Dr
- 369 1st West Pkwy
- 307 1st West Pkwy
- 408 E Mountain View Dr
- 407 1st Pkwy W
- 245 1st West Pkwy
- 239 E Mountain View Dr
- 426 E Mountain View Dr
- 338 1st West Pkwy
- 228 E Mountain View Dr
- 354 1st West Pkwy