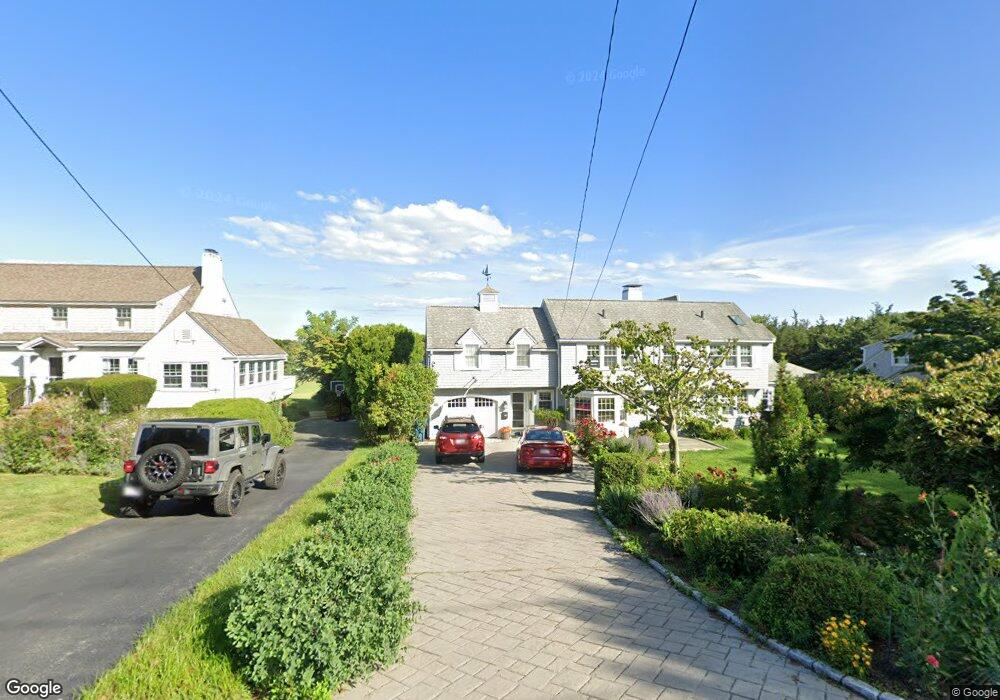
338 Elm Rd Falmouth, MA 02540
Falmouth Village NeighborhoodEstimated Value: $1,780,000 - $2,294,000
4
Beds
4
Baths
2,786
Sq Ft
$734/Sq Ft
Est. Value
About This Home
This home is located at 338 Elm Rd, Falmouth, MA 02540 and is currently estimated at $2,045,076, approximately $734 per square foot. 338 Elm Rd is a home located in Barnstable County with nearby schools including Mullen-Hall School, Lawrence School, and Morse Pond School.
Ownership History
Date
Name
Owned For
Owner Type
Purchase Details
Closed on
Dec 19, 2023
Sold by
Sbarra Judith S and Sbarra Thomas
Bought by
Sbrra Ft and Sbarra
Current Estimated Value
Purchase Details
Closed on
Jan 9, 2018
Sold by
Sbarra Thomas and Smith-Sbarra Judith
Bought by
Smith-Sbarra Judith
Purchase Details
Closed on
May 15, 1980
Bought by
Sbarra Thomas and Sbarra Judith S
Create a Home Valuation Report for This Property
The Home Valuation Report is an in-depth analysis detailing your home's value as well as a comparison with similar homes in the area
Home Values in the Area
Average Home Value in this Area
Purchase History
| Date | Buyer | Sale Price | Title Company |
|---|---|---|---|
| Sbrra Ft | -- | None Available | |
| Smith-Sbarra Judith | -- | -- | |
| Sbarra Thomas | $125,000 | -- |
Source: Public Records
Mortgage History
| Date | Status | Borrower | Loan Amount |
|---|---|---|---|
| Previous Owner | Sbarra Thomas | $203,150 | |
| Previous Owner | Sbarra Thomas | $187,500 | |
| Previous Owner | Sbarra Thomas | $155,000 |
Source: Public Records
Tax History Compared to Growth
Tax History
| Year | Tax Paid | Tax Assessment Tax Assessment Total Assessment is a certain percentage of the fair market value that is determined by local assessors to be the total taxable value of land and additions on the property. | Land | Improvement |
|---|---|---|---|---|
| 2025 | $10,801 | $1,840,000 | $1,014,800 | $825,200 |
| 2024 | $10,248 | $1,631,800 | $881,700 | $750,100 |
| 2023 | $9,617 | $1,389,800 | $760,700 | $629,100 |
| 2022 | $9,084 | $1,128,500 | $610,800 | $517,700 |
| 2021 | $8,582 | $1,009,600 | $559,900 | $449,700 |
| 2020 | $8,235 | $958,700 | $509,000 | $449,700 |
| 2019 | $7,963 | $930,300 | $509,000 | $421,300 |
| 2018 | $7,895 | $906,500 | $509,000 | $397,500 |
| 2017 | $7,607 | $891,800 | $509,000 | $382,800 |
| 2016 | $7,464 | $891,800 | $509,000 | $382,800 |
| 2015 | $7,304 | $891,800 | $509,000 | $382,800 |
| 2014 | $6,861 | $841,800 | $489,300 | $352,500 |
Source: Public Records
Map
Nearby Homes
- 38 Landfall Unit 38
- 38 Landfall
- 87 Oyster Pond Rd
- 15 Hedge Ln
- 251 Woods Hole Rd
- 65 Walker St
- 71 Main St
- 98 Main St
- 98 Main St Unit 1
- 44 Carey Ln
- 30 Katherine Lee Bates Rd
- 33 Oakwood Ave
- 76 F r Lillie Rd
- 45 Haynes Ave
- 27 Upland Ave
- 29 Wilson Rd
- 480 Main St Unit 1
- 253 Scranton Ave
- 110 Dillingham Ave Unit 322
- 9 Fairmount Ave Unit 1