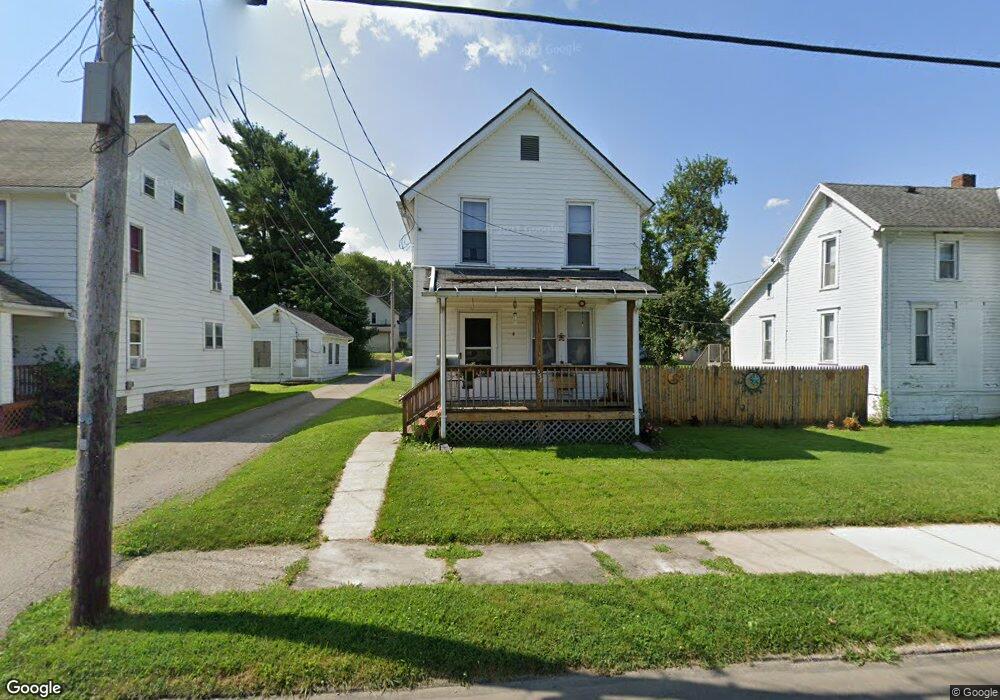
338 Grace St Mansfield, OH 44902
Estimated Value: $57,000 - $80,000
3
Beds
1
Bath
1,080
Sq Ft
$65/Sq Ft
Est. Value
About This Home
This home is located at 338 Grace St, Mansfield, OH 44902 and is currently estimated at $70,429, approximately $65 per square foot. 338 Grace St is a home located in Richland County with nearby schools including St. Peter's Elementary/Montessori School, Temple-Christian School, and St. Peter's Junior High / High School.
Ownership History
Date
Name
Owned For
Owner Type
Purchase Details
Closed on
Jun 22, 2016
Sold by
Little George R and Little Jane L
Bought by
Blankenship Penny A
Current Estimated Value
Purchase Details
Closed on
Jun 13, 2002
Sold by
Lbs Inc
Bought by
Little George R and Little Jane L
Purchase Details
Closed on
Jul 16, 2001
Sold by
Shrf David Hall Pr
Bought by
Lbs Inc
Purchase Details
Closed on
Dec 7, 1998
Sold by
Clark Jon C
Bought by
Hall David E and Hall Cynthia K
Purchase Details
Closed on
Jan 14, 1998
Sold by
Clark Jon C
Bought by
Hall David E and Hall Cynthia K
Purchase Details
Closed on
Nov 2, 1995
Sold by
Atterholt Ruth J
Bought by
Clark Carroll E and Clark Leona C
Home Financials for this Owner
Home Financials are based on the most recent Mortgage that was taken out on this home.
Original Mortgage
$40,000
Interest Rate
7.61%
Mortgage Type
New Conventional
Create a Home Valuation Report for This Property
The Home Valuation Report is an in-depth analysis detailing your home's value as well as a comparison with similar homes in the area
Home Values in the Area
Average Home Value in this Area
Purchase History
| Date | Buyer | Sale Price | Title Company |
|---|---|---|---|
| Blankenship Penny A | $25,000 | Chicago Title | |
| Little George R | $8,000 | -- | |
| Lbs Inc | $15,000 | -- | |
| Hall David E | $13,500 | -- | |
| Hall David E | $22,900 | -- | |
| Clark Carroll E | $80,000 | -- |
Source: Public Records
Mortgage History
| Date | Status | Borrower | Loan Amount |
|---|---|---|---|
| Previous Owner | Clark Carroll E | $40,000 |
Source: Public Records
Tax History
| Year | Tax Paid | Tax Assessment Tax Assessment Total Assessment is a certain percentage of the fair market value that is determined by local assessors to be the total taxable value of land and additions on the property. | Land | Improvement |
|---|---|---|---|---|
| 2024 | $516 | $10,780 | $1,510 | $9,270 |
| 2023 | $516 | $10,780 | $1,510 | $9,270 |
| 2022 | $423 | $7,400 | $1,530 | $5,870 |
| 2021 | $426 | $7,400 | $1,530 | $5,870 |
| 2020 | $435 | $7,400 | $1,530 | $5,870 |
| 2019 | $483 | $7,400 | $1,530 | $5,870 |
| 2018 | $476 | $7,400 | $1,530 | $5,870 |
| 2017 | $463 | $7,400 | $1,530 | $5,870 |
| 2016 | $351 | $5,440 | $2,030 | $3,410 |
| 2015 | $335 | $5,440 | $2,030 | $3,410 |
| 2014 | $331 | $5,440 | $2,030 | $3,410 |
| 2012 | $131 | $5,610 | $2,100 | $3,510 |
Source: Public Records
Map
Nearby Homes
- 411 Grace St
- 382 Orange St
- 754 Abbott Dr
- 0 Smith Ave
- 580 N Mulberry St
- 118 Raymond Ave
- 524 Lida St
- 0 Lot #23128 Unit 9069815
- 183 E 1st St
- 146 E 1st St
- 167 S Adams St
- 62 Bahl Ave
- 0 Voegele Ave Unit Lot 6048, 6049, 6
- 0 Wesley
- 969 Grace St
- 223 Hedges St
- 203 Home Ave
- 906 Duke Ave
- 466 Pennsylvania Ave
- 175 S Mulberry St
Your Personal Tour Guide
Ask me questions while you tour the home.