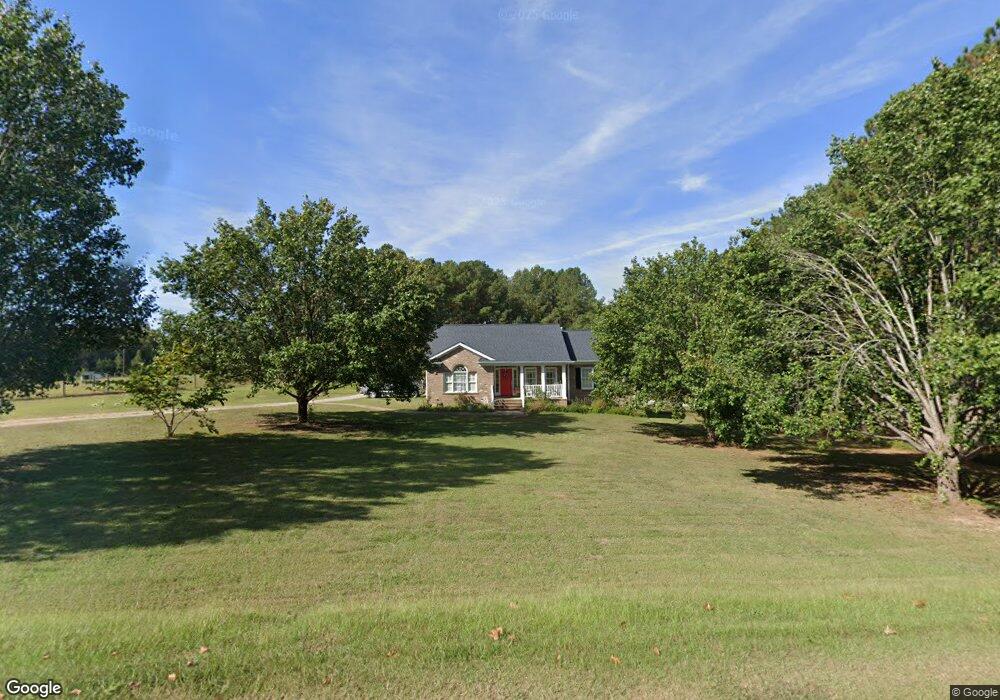
338 J B Leonard Rd Castalia, NC 27816
Estimated Value: $248,000 - $289,000
3
Beds
2
Baths
1,566
Sq Ft
$176/Sq Ft
Est. Value
About This Home
This home is located at 338 J B Leonard Rd, Castalia, NC 27816 and is currently estimated at $275,324, approximately $175 per square foot. 338 J B Leonard Rd is a home located in Franklin County with nearby schools including Edward Best Elementary School and Louisburg High School.
Ownership History
Date
Name
Owned For
Owner Type
Purchase Details
Closed on
Feb 5, 2021
Sold by
Lewis Nadine
Bought by
Vanfleet Lisa
Current Estimated Value
Home Financials for this Owner
Home Financials are based on the most recent Mortgage that was taken out on this home.
Original Mortgage
$185,250
Outstanding Balance
$140,763
Interest Rate
5%
Mortgage Type
Balloon
Estimated Equity
$134,561
Purchase Details
Closed on
Jun 21, 2019
Sold by
Vanfleet Erica
Bought by
Vanfleet Jennifer
Purchase Details
Closed on
Mar 5, 2019
Sold by
Vanfleet Sarah
Bought by
Lewis Nadine A
Purchase Details
Closed on
Feb 2, 2019
Sold by
Vanfleet Amy and Vanfleet James
Bought by
Lewis Nadine A
Purchase Details
Closed on
Mar 13, 2008
Sold by
Lewis W John W and Lewis Nadine
Bought by
Davis Jack and Davis Gloria
Purchase Details
Closed on
Mar 26, 2004
Bought by
Lewis John and Lewis Nadine
Create a Home Valuation Report for This Property
The Home Valuation Report is an in-depth analysis detailing your home's value as well as a comparison with similar homes in the area
Home Values in the Area
Average Home Value in this Area
Purchase History
| Date | Buyer | Sale Price | Title Company |
|---|---|---|---|
| Vanfleet Lisa | $195,000 | None Available | |
| Vanfleet Lisa | $195,000 | None Listed On Document | |
| Vanfleet Jennifer | $3,000 | None Available | |
| Lewis Nadine A | $1,000 | None Available | |
| Lewis Nadine A | $6,000 | None Available | |
| Davis Jack | -- | None Available | |
| Lewis John | $150,000 | -- |
Source: Public Records
Mortgage History
| Date | Status | Borrower | Loan Amount |
|---|---|---|---|
| Open | Vanfleet Lisa | $185,250 |
Source: Public Records
Tax History Compared to Growth
Tax History
| Year | Tax Paid | Tax Assessment Tax Assessment Total Assessment is a certain percentage of the fair market value that is determined by local assessors to be the total taxable value of land and additions on the property. | Land | Improvement |
|---|---|---|---|---|
| 2025 | $1,675 | $250,400 | $42,810 | $207,590 |
| 2024 | $1,675 | $250,400 | $42,810 | $207,590 |
| 2023 | $1,464 | $149,570 | $14,110 | $135,460 |
| 2022 | $1,424 | $149,570 | $14,110 | $135,460 |
| 2021 | $1,420 | $149,570 | $14,110 | $135,460 |
| 2020 | $1,428 | $149,570 | $14,110 | $135,460 |
| 2019 | $1,400 | $149,570 | $14,110 | $135,460 |
| 2018 | $1,395 | $149,570 | $14,110 | $135,460 |
| 2017 | $1,583 | $155,750 | $12,830 | $142,920 |
| 2016 | $1,638 | $155,750 | $12,830 | $142,920 |
| 2015 | $1,638 | $155,750 | $12,830 | $142,920 |
| 2014 | $1,531 | $155,750 | $12,830 | $142,920 |
Source: Public Records
Map
Nearby Homes
- 4.29 Acres Leonard Rd
- 9.56 Acres Leonard Rd
- 2150 N Carolina 58
- 317 Brewer Rd
- 1056 N Carolina 58
- 0 Ruffin St Unit LotWP001 22913858
- 348 Raymond Tharrington Rd
- 721 N Carolina 58
- 457 Reynolds Rd
- 620 Raymond Tharrington Rd
- 00 Reynolds Rd
- 973 Vaiden Rd
- 0 Vaiden Rd Unit 10102990
- 917 Vaiden Rd
- 15 Gina Lee Terrace
- 290 Collie Rd
- 3787 N Carolina 58
- 0 Shortleaf Dr Unit 10119597
- 0 Stallings Mill Rd
- 00 Stallings Mill Rd Unit LotWP007
- 297 J B Leonard Rd
- 297 J B Leonard Rd
- 297 J B Leonard Rd
- 355 J B Leonard Rd
- 330 J B Leonard Rd
- 330 J B Leonard Rd
- 344 J B Leonard Rd
- 360 J B Leonard Rd
- 419 J B Leonard Rd
- 421 J B Leonard Rd
- 449 J B Leonard Rd
- 449 J B Leonard Rd
- 187 J B Leonard Rd
- 455 Fred Parrish Rd
- 493 Fred Parrish Rd
- 493 Fred Parrish Rd
- 0 Fred Parrish Rd Unit 903552
- 0 Fred Parrish Rd Unit 1001799
- 0 Fred Parrish Rd
- 0 Fred Parrish Rd