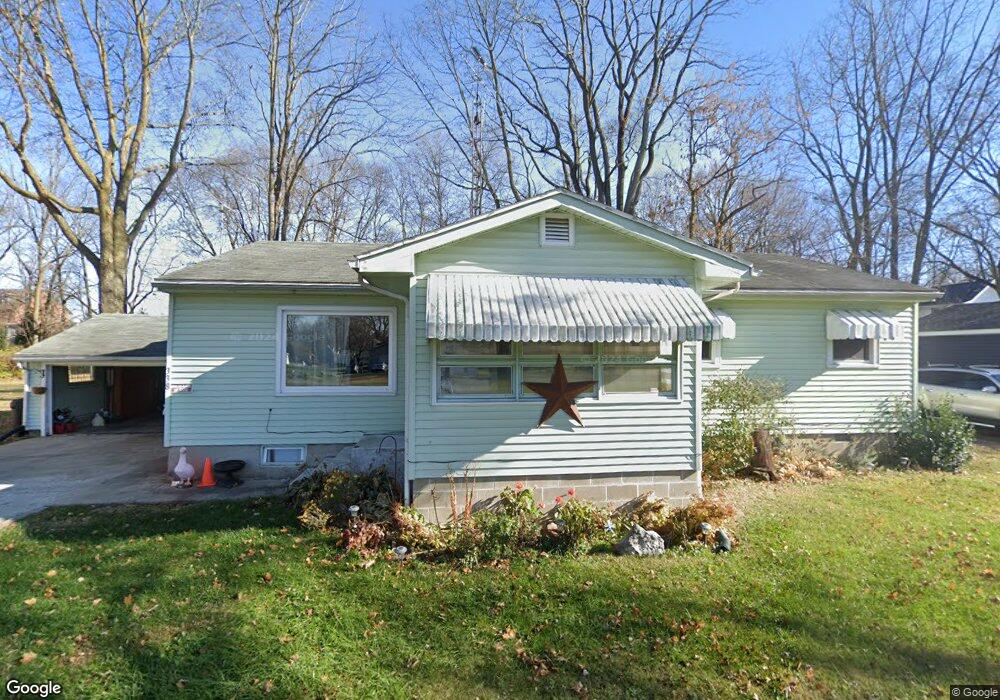
338 Johnson Dr Urbana, OH 43078
Estimated Value: $170,000 - $186,000
2
Beds
2
Baths
1,192
Sq Ft
$149/Sq Ft
Est. Value
About This Home
This home is located at 338 Johnson Dr, Urbana, OH 43078 and is currently estimated at $177,603, approximately $148 per square foot. 338 Johnson Dr is a home located in Champaign County with nearby schools including Urbana Elementary School, Urbana High School, and Urbana Community School.
Ownership History
Date
Name
Owned For
Owner Type
Purchase Details
Closed on
Dec 15, 2020
Sold by
Porter Suzanne
Bought by
Porter Stacy A
Current Estimated Value
Purchase Details
Closed on
Jul 9, 2014
Sold by
Watkins Robbie Deweese
Bought by
Porter Suzanne
Home Financials for this Owner
Home Financials are based on the most recent Mortgage that was taken out on this home.
Original Mortgage
$83,235
Outstanding Balance
$26,357
Interest Rate
4.11%
Mortgage Type
Purchase Money Mortgage
Estimated Equity
$151,246
Create a Home Valuation Report for This Property
The Home Valuation Report is an in-depth analysis detailing your home's value as well as a comparison with similar homes in the area
Home Values in the Area
Average Home Value in this Area
Purchase History
| Date | Buyer | Sale Price | Title Company |
|---|---|---|---|
| Porter Stacy A | -- | None Available | |
| Porter Suzanne | $75,000 | None Avaiblable |
Source: Public Records
Mortgage History
| Date | Status | Borrower | Loan Amount |
|---|---|---|---|
| Open | Porter Suzanne | $83,235 |
Source: Public Records
Tax History Compared to Growth
Tax History
| Year | Tax Paid | Tax Assessment Tax Assessment Total Assessment is a certain percentage of the fair market value that is determined by local assessors to be the total taxable value of land and additions on the property. | Land | Improvement |
|---|---|---|---|---|
| 2024 | $1,478 | $35,140 | $5,320 | $29,820 |
| 2023 | $1,500 | $35,140 | $5,320 | $29,820 |
| 2022 | $1,507 | $35,140 | $5,320 | $29,820 |
| 2021 | $967 | $29,170 | $4,240 | $24,930 |
| 2020 | $967 | $29,170 | $4,240 | $24,930 |
| 2019 | $955 | $29,170 | $4,240 | $24,930 |
| 2018 | $778 | $24,650 | $3,400 | $21,250 |
| 2017 | $772 | $24,650 | $3,400 | $21,250 |
| 2016 | $774 | $24,650 | $3,400 | $21,250 |
| 2015 | $747 | $23,630 | $3,400 | $20,230 |
| 2014 | $747 | $23,620 | $3,390 | $20,230 |
| 2013 | $1,038 | $23,620 | $3,390 | $20,230 |
Source: Public Records
Map
Nearby Homes