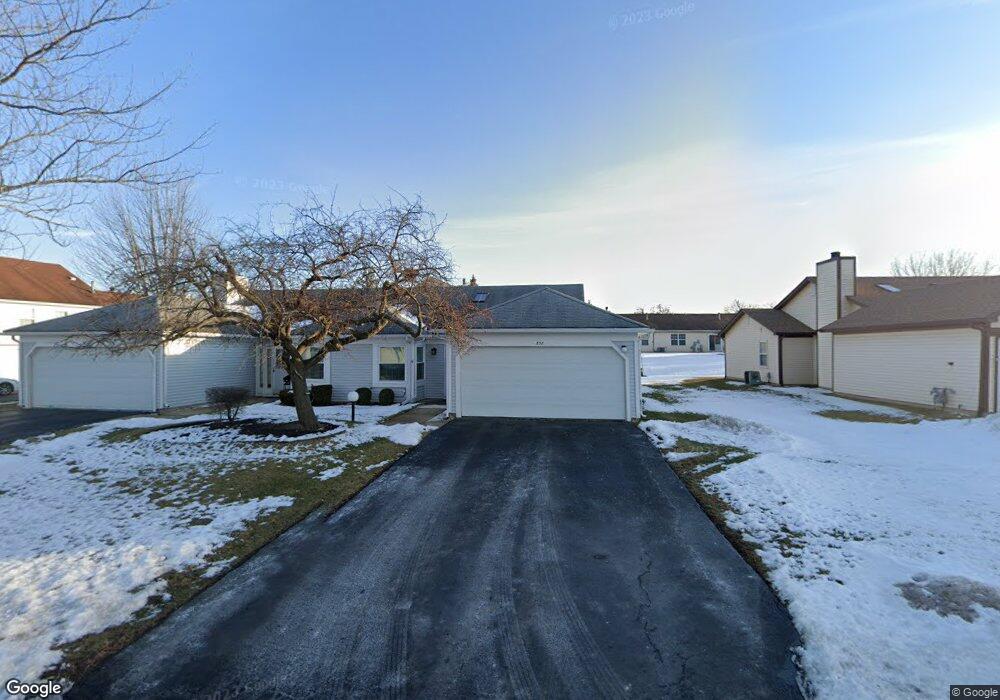
338 Juniper Cir Unit 2C Streamwood, IL 60107
Woodland Heights NeighborhoodEstimated Value: $271,000 - $298,000
2
Beds
1
Bath
1,146
Sq Ft
$250/Sq Ft
Est. Value
About This Home
This home is located at 338 Juniper Cir Unit 2C, Streamwood, IL 60107 and is currently estimated at $286,048, approximately $249 per square foot. 338 Juniper Cir Unit 2C is a home located in Cook County with nearby schools including Ridge Circle Elementary School, Canton Middle School, and Streamwood High School.
Ownership History
Date
Name
Owned For
Owner Type
Purchase Details
Closed on
May 13, 2016
Sold by
Hoarle Viola A
Bought by
Katz Joe
Current Estimated Value
Home Financials for this Owner
Home Financials are based on the most recent Mortgage that was taken out on this home.
Original Mortgage
$135,850
Outstanding Balance
$110,176
Interest Rate
4.25%
Mortgage Type
New Conventional
Estimated Equity
$175,872
Purchase Details
Closed on
Dec 5, 2003
Sold by
Polka Joseph and Polka Linda L Holmen
Bought by
Hoarle Donald H and Hoarle Viola A
Home Financials for this Owner
Home Financials are based on the most recent Mortgage that was taken out on this home.
Original Mortgage
$170,340
Interest Rate
5.94%
Mortgage Type
VA
Purchase Details
Closed on
Dec 17, 1993
Sold by
Palumbo Frank and Palumbo Maria G
Bought by
Polka Joseph and Holmen Polka Linda L
Home Financials for this Owner
Home Financials are based on the most recent Mortgage that was taken out on this home.
Original Mortgage
$115,566
Interest Rate
7.25%
Mortgage Type
FHA
Create a Home Valuation Report for This Property
The Home Valuation Report is an in-depth analysis detailing your home's value as well as a comparison with similar homes in the area
Home Values in the Area
Average Home Value in this Area
Purchase History
| Date | Buyer | Sale Price | Title Company |
|---|---|---|---|
| Katz Joe | $143,000 | Greater Indiana Title | |
| Hoarle Donald H | $167,000 | -- | |
| Polka Joseph | $116,000 | First American Title Insuran |
Source: Public Records
Mortgage History
| Date | Status | Borrower | Loan Amount |
|---|---|---|---|
| Open | Katz Joe | $135,850 | |
| Previous Owner | Hoarle Donald H | $170,340 | |
| Previous Owner | Polka Joseph | $115,566 |
Source: Public Records
Tax History Compared to Growth
Tax History
| Year | Tax Paid | Tax Assessment Tax Assessment Total Assessment is a certain percentage of the fair market value that is determined by local assessors to be the total taxable value of land and additions on the property. | Land | Improvement |
|---|---|---|---|---|
| 2024 | $5,755 | $22,000 | $3,500 | $18,500 |
| 2023 | $5,573 | $22,000 | $3,500 | $18,500 |
| 2022 | $5,573 | $22,000 | $3,500 | $18,500 |
| 2021 | $4,151 | $14,684 | $6,161 | $8,523 |
| 2020 | $4,162 | $14,684 | $6,161 | $8,523 |
| 2019 | $4,176 | $16,499 | $6,161 | $10,338 |
| 2018 | $3,806 | $14,242 | $5,371 | $8,871 |
| 2017 | $4,947 | $14,242 | $5,371 | $8,871 |
| 2016 | $4,613 | $14,242 | $5,371 | $8,871 |
| 2015 | $2,647 | $11,987 | $4,739 | $7,248 |
| 2014 | $2,552 | $11,987 | $4,739 | $7,248 |
| 2013 | $2,532 | $11,987 | $4,739 | $7,248 |
Source: Public Records
Map
Nearby Homes
- 324 Juniper Cir
- 272 Juniper Cir
- 27 Ridge Cir
- 206 Ridge Cir
- 2933 Heatherwood Dr Unit 1915
- 125 Seton Place
- 226 Sierra Pass Dr Unit 62262
- 171 Sierra Pass Dr Unit 261713
- 8 Aspen Ct
- 2814 Belle Ln Unit 128A28
- 1 Aspen Ct
- 239 Camel Bend Ct Unit 36239
- 368 Maidstone Ct Unit 15368A
- 247 Camel Bend Ct Unit 37247
- 55 W Green Meadows Blvd
- 2868 Belle Ln Unit 143B28
- 195 Island Ct
- 707 Sunset Cir
- 368 Glen Byrn Ct Unit 11368A
- 2902 Belle Ln
- 344 Juniper Cir
- 336 Juniper Cir
- 346 Juniper Cir
- 220 Whitewood Dr
- 326 Juniper Cir
- 322 Juniper Cir
- 222 Whitewood Dr
- 210 Whitewood Dr
- 352 Juniper Cir
- 356 Juniper Cir
- 320 Juniper Cir
- 320 Juniper Cir Unit 2-C
- 208 Whitewood Dr
- 216 Whitewood Dr Unit 5
- 228 Whitewood Dr
- 218 Whitewood Dr
- 141 East Ave
- 143 East Ave
- 337 Juniper Cir
- 202 Whitewood Dr