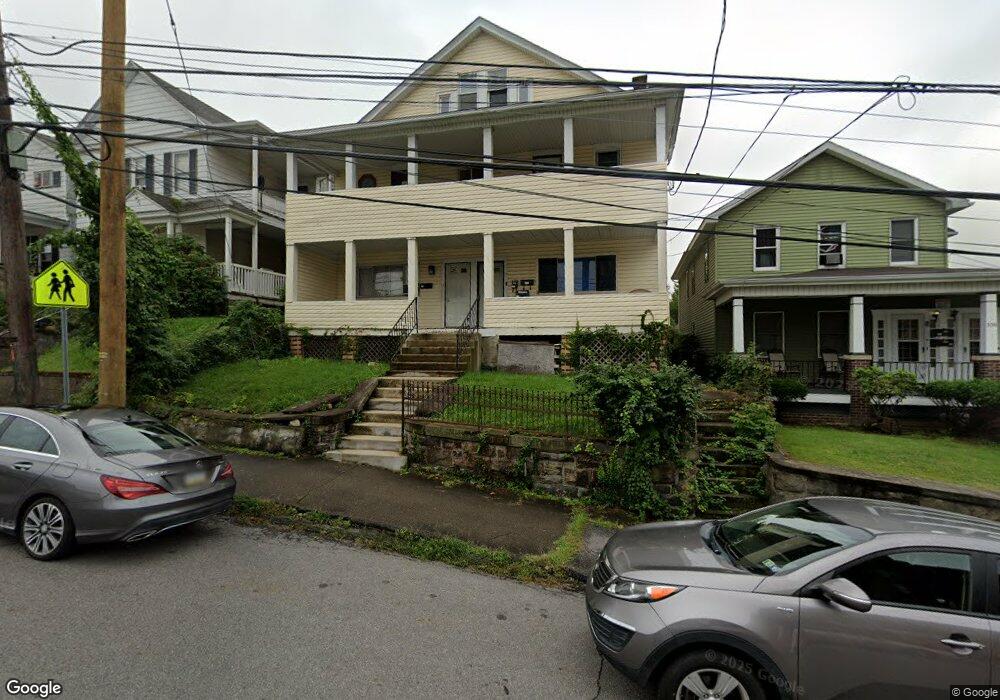
338 Maple St Unit 340 Scranton, PA 18505
South Side NeighborhoodEstimated Value: $189,750 - $259,000
Studio
--
Bath
--
Sq Ft
6,360
Sq Ft Lot
About This Home
This home is located at 338 Maple St Unit 340, Scranton, PA 18505 and is currently estimated at $222,438. 338 Maple St Unit 340 is a home located in Lackawanna County with nearby schools including McNichols Plaza Elementary School, South Scranton Intermediate, and West Scranton High School.
Ownership History
Date
Name
Owned For
Owner Type
Purchase Details
Closed on
Feb 25, 2019
Sold by
Historic Prop Holdings Llc
Bought by
Rental Depot Inc
Current Estimated Value
Purchase Details
Closed on
Jun 14, 2013
Sold by
Fannie Mae
Bought by
Historic Prop Holdings Llc
Purchase Details
Closed on
Apr 11, 2013
Sold by
Bar Horin Isaac and Rubinstein Eliezer
Bought by
Federal National Mortgage Association
Purchase Details
Closed on
Apr 28, 2006
Sold by
Map Gibson Llc
Bought by
Bar Horin Isaac and Rubinstein Eliezer
Home Financials for this Owner
Home Financials are based on the most recent Mortgage that was taken out on this home.
Original Mortgage
$101,250
Interest Rate
6.4%
Mortgage Type
Commercial
Purchase Details
Closed on
Mar 17, 2006
Sold by
Friedman Zelig
Bought by
Map Gibson Llc
Home Financials for this Owner
Home Financials are based on the most recent Mortgage that was taken out on this home.
Original Mortgage
$101,250
Interest Rate
6.4%
Mortgage Type
Commercial
Create a Home Valuation Report for This Property
The Home Valuation Report is an in-depth analysis detailing your home's value as well as a comparison with similar homes in the area
Home Values in the Area
Average Home Value in this Area
Purchase History
| Date | Buyer | Sale Price | Title Company |
|---|---|---|---|
| Rental Depot Inc | $120,000 | None Available | |
| Historic Prop Holdings Llc | $24,500 | None Available | |
| Federal National Mortgage Association | $1,459 | None Available | |
| Bar Horin Isaac | $135,000 | None Available | |
| Map Gibson Llc | -- | None Available |
Source: Public Records
Mortgage History
| Date | Status | Borrower | Loan Amount |
|---|---|---|---|
| Previous Owner | Bar Horin Isaac | $101,250 |
Source: Public Records
Tax History
| Year | Tax Paid | Tax Assessment Tax Assessment Total Assessment is a certain percentage of the fair market value that is determined by local assessors to be the total taxable value of land and additions on the property. | Land | Improvement |
|---|---|---|---|---|
| 2025 | $3,785 | $11,374 | $2,450 | $8,924 |
| 2024 | $3,467 | $11,374 | $2,450 | $8,924 |
| 2023 | $3,467 | $11,374 | $2,450 | $8,924 |
| 2022 | $3,391 | $11,374 | $2,450 | $8,924 |
| 2021 | $3,391 | $11,374 | $2,450 | $8,924 |
| 2020 | $3,330 | $11,374 | $2,450 | $8,924 |
| 2019 | $3,135 | $11,374 | $2,450 | $8,924 |
| 2018 | $3,135 | $11,374 | $2,450 | $8,924 |
| 2017 | $3,082 | $11,374 | $2,450 | $8,924 |
| 2016 | $0 | $11,374 | $2,450 | $8,924 |
| 2015 | $2,335 | $11,374 | $2,450 | $8,924 |
| 2014 | -- | $11,374 | $2,450 | $8,924 |
Source: Public Records
Map
Nearby Homes
- 333 E Elm St
- 326 Neptune Place
- 828 Pittston Ave
- 1017 Hamm Ct
- 1131 Pittston Ave
- 710 Pittston Ave
- 514 Brook St
- 616 Birch St
- 635 E Elm St Unit Rear
- 439 Alder St
- 1024 S Webster Ave
- 518 Kirst Ct
- 1419 Pittston Ave
- 501-503 Cedar Ave
- 1508 Cedar Ave
- 511 Fig St
- 1019 S Webster Ave
- 1429 Prospect Ave
- 718 Willow St
- 522 524 River St
- 338 340 Maple St
- 338 Maple St
- 344 Maple St
- 340 Maple St
- 344 - 348 Maple St
- 346 Maple St Unit 348
- 346-348 Maple St
- 332 Maple St
- 332 Maple St
- 348 Maple St
- 328 Maple St
- 346 348 Maple St
- 1014 Cedar Ave
- 1014 Cedar Ave Unit 1-842
- 352 Maple St Unit 354
- 352 Maple St
- 352 354 Maple St
- 326 Maple St
- 326 Maple St
- 326 Maple St Unit 328
Your Personal Tour Guide
Ask me questions while you tour the home.