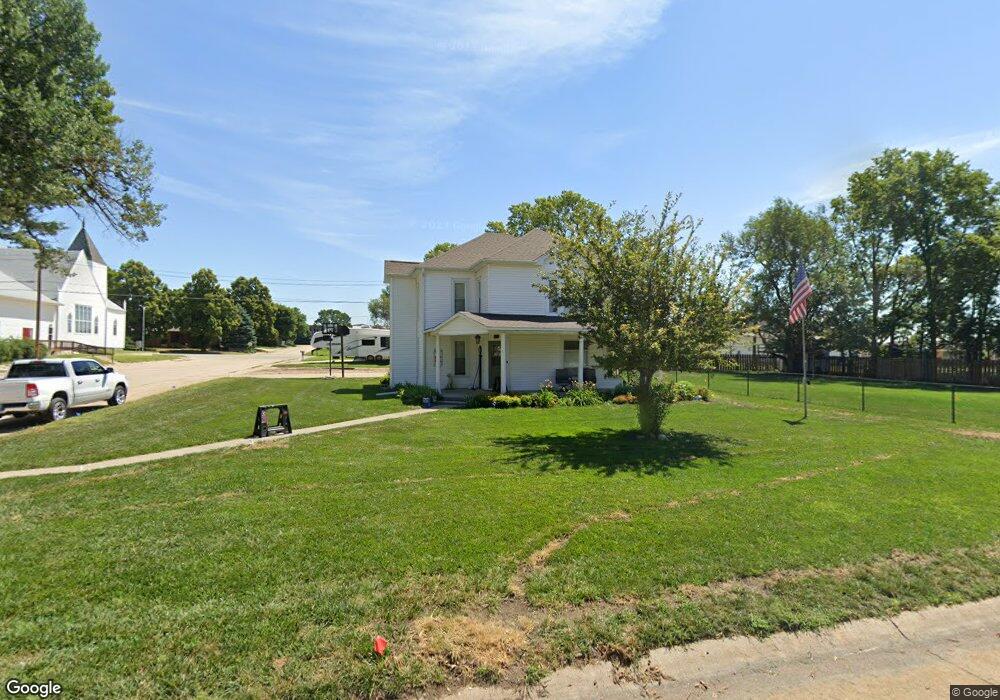
338 N 11th Ave Broken Bow, NE 68822
Estimated Value: $234,000 - $414,000
4
Beds
3
Baths
2,160
Sq Ft
$141/Sq Ft
Est. Value
About This Home
This home is located at 338 N 11th Ave, Broken Bow, NE 68822 and is currently estimated at $304,820, approximately $141 per square foot. 338 N 11th Ave is a home located in Custer County with nearby schools including North Park Elementary School, Broken Bow Junior High School, and Broken Bow High School.
Ownership History
Date
Name
Owned For
Owner Type
Purchase Details
Closed on
Mar 10, 2025
Sold by
Armstrong Christopher M and Armstrong Margie A
Bought by
Settje Dean
Current Estimated Value
Purchase Details
Closed on
Nov 25, 2015
Sold by
Nathan Bell and Nathan Lisa R
Bought by
Garcia Chad A and Garcia Melissa A
Purchase Details
Closed on
Dec 23, 2004
Sold by
Jilg Douglas K and Jilg Carol A
Bought by
Bell Nathan and Bell Lisa R
Create a Home Valuation Report for This Property
The Home Valuation Report is an in-depth analysis detailing your home's value as well as a comparison with similar homes in the area
Home Values in the Area
Average Home Value in this Area
Purchase History
| Date | Buyer | Sale Price | Title Company |
|---|---|---|---|
| Settje Dean | $240,000 | Custer Title & Abs | |
| Garcia Chad A | $155,000 | -- | |
| Bell Nathan | $102,500 | -- |
Source: Public Records
Tax History Compared to Growth
Tax History
| Year | Tax Paid | Tax Assessment Tax Assessment Total Assessment is a certain percentage of the fair market value that is determined by local assessors to be the total taxable value of land and additions on the property. | Land | Improvement |
|---|---|---|---|---|
| 2025 | $3,143 | $246,643 | $30,106 | $216,537 |
| 2024 | $3,143 | $224,989 | $30,106 | $194,883 |
| 2023 | $2,750 | $175,565 | $30,106 | $145,459 |
| 2022 | $3,184 | $173,487 | $30,106 | $143,381 |
| 2021 | $3,078 | $171,605 | $28,224 | $143,381 |
| 2020 | $3,052 | $171,605 | $28,224 | $143,381 |
| 2019 | $2,692 | $151,614 | $14,112 | $137,502 |
| 2017 | $2,310 | $126,503 | $14,112 | $112,391 |
| 2016 | $2,419 | $121,046 | $8,655 | $112,391 |
| 2015 | $2,332 | $115,686 | $8,487 | $107,199 |
| 2014 | $2,332 | $105,169 | $7,715 | $97,454 |
Source: Public Records
Map
Nearby Homes