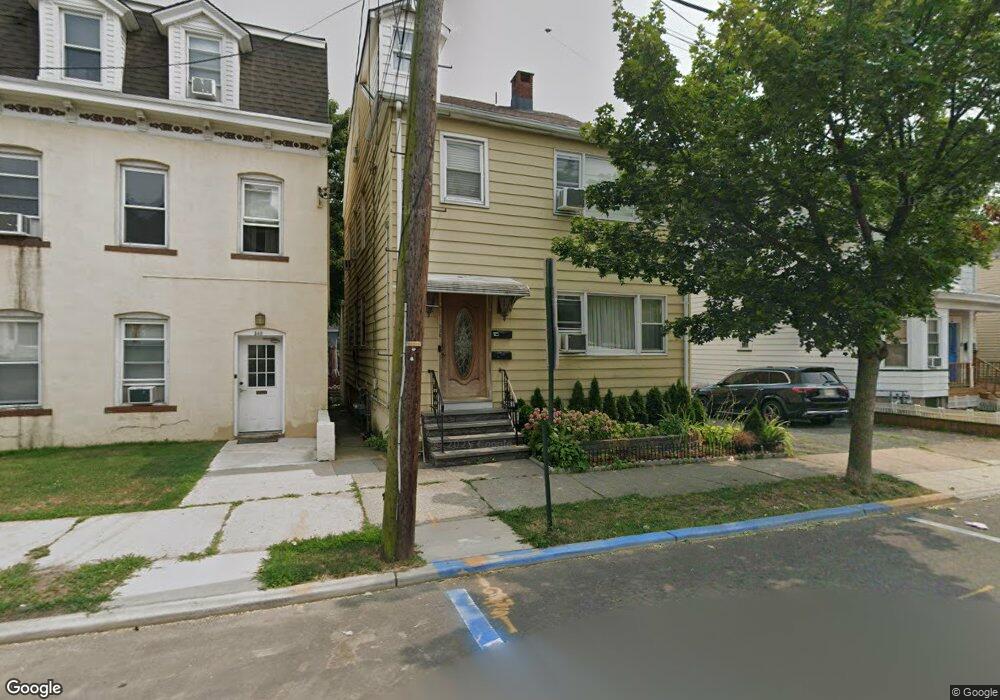
338 N 11th St Prospect Park, NJ 07508
Estimated Value: $581,000 - $717,000
--
Bed
--
Bath
2,242
Sq Ft
$291/Sq Ft
Est. Value
About This Home
This home is located at 338 N 11th St, Prospect Park, NJ 07508 and is currently estimated at $652,128, approximately $290 per square foot. 338 N 11th St is a home located in Passaic County with nearby schools including Number 1, Prospect Park Elementary School, Manchester Reg High School, and Al-Hikmah Elementary School.
Ownership History
Date
Name
Owned For
Owner Type
Purchase Details
Closed on
Sep 30, 2002
Sold by
Delvalle Juan
Bought by
Wright Warrell and Wright Deneshia
Current Estimated Value
Home Financials for this Owner
Home Financials are based on the most recent Mortgage that was taken out on this home.
Original Mortgage
$218,500
Outstanding Balance
$90,733
Interest Rate
6.03%
Estimated Equity
$561,395
Purchase Details
Closed on
Oct 21, 1999
Sold by
338 Stonehouse Llc
Bought by
Delvalle Juan F
Home Financials for this Owner
Home Financials are based on the most recent Mortgage that was taken out on this home.
Original Mortgage
$123,000
Interest Rate
7.68%
Purchase Details
Closed on
Dec 17, 1998
Sold by
Stonehouse Allan A and Stonehouse Philus
Bought by
338 Stonehouse Llc
Create a Home Valuation Report for This Property
The Home Valuation Report is an in-depth analysis detailing your home's value as well as a comparison with similar homes in the area
Home Values in the Area
Average Home Value in this Area
Purchase History
| Date | Buyer | Sale Price | Title Company |
|---|---|---|---|
| Wright Warrell | $218,500 | -- | |
| Delvalle Juan F | $145,000 | -- | |
| 338 Stonehouse Llc | -- | -- |
Source: Public Records
Mortgage History
| Date | Status | Borrower | Loan Amount |
|---|---|---|---|
| Open | Wright Warrell | $218,500 | |
| Previous Owner | Delvalle Juan F | $123,000 |
Source: Public Records
Tax History Compared to Growth
Tax History
| Year | Tax Paid | Tax Assessment Tax Assessment Total Assessment is a certain percentage of the fair market value that is determined by local assessors to be the total taxable value of land and additions on the property. | Land | Improvement |
|---|---|---|---|---|
| 2025 | $14,693 | $246,900 | $65,300 | $181,600 |
| 2024 | $13,634 | $246,900 | $65,300 | $181,600 |
| 2022 | $13,352 | $246,900 | $65,300 | $181,600 |
| 2021 | $13,335 | $246,900 | $65,300 | $181,600 |
| 2020 | $12,913 | $246,900 | $65,300 | $181,600 |
| 2019 | $12,780 | $246,900 | $65,300 | $181,600 |
| 2018 | $12,654 | $246,900 | $65,300 | $181,600 |
| 2017 | $12,476 | $246,900 | $65,300 | $181,600 |
| 2016 | $12,313 | $246,900 | $65,300 | $181,600 |
| 2015 | $11,644 | $246,900 | $65,300 | $181,600 |
| 2014 | $9,797 | $148,400 | $50,000 | $98,400 |
Source: Public Records
Map
Nearby Homes