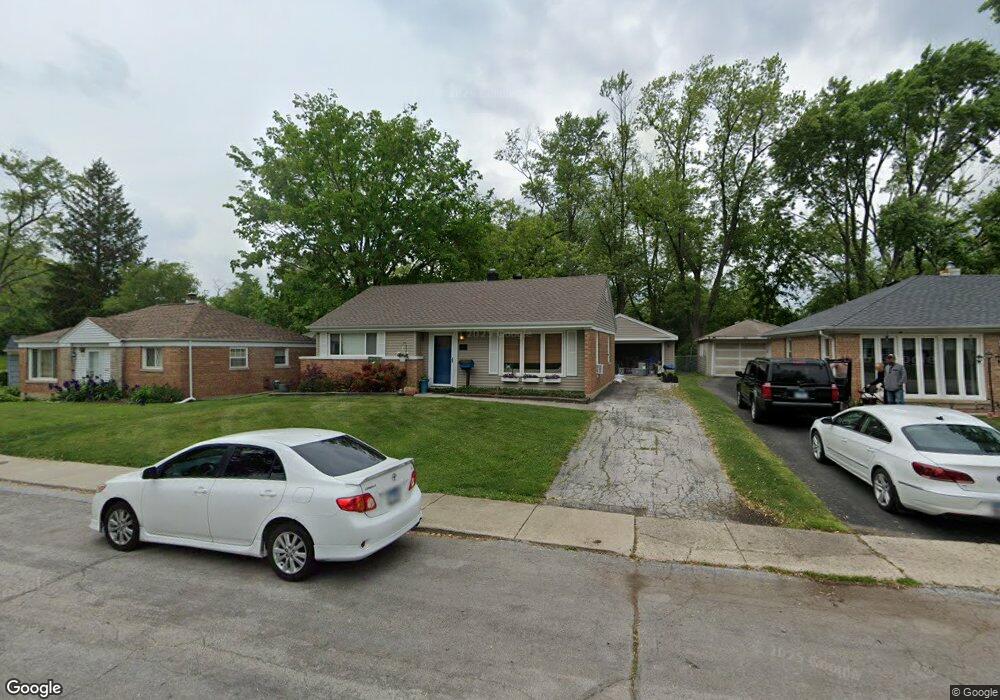
338 Niagara St Park Forest, IL 60466
Estimated Value: $121,000 - $206,000
2
Beds
1
Bath
974
Sq Ft
$154/Sq Ft
Est. Value
About This Home
This home is located at 338 Niagara St, Park Forest, IL 60466 and is currently estimated at $150,472, approximately $154 per square foot. 338 Niagara St is a home located in Cook County with nearby schools including Blackhawk Intermediate Center, 21st Century Primary Center, and Michelle Obama School of Technology.
Ownership History
Date
Name
Owned For
Owner Type
Purchase Details
Closed on
Jul 24, 2004
Sold by
Noles Tony D
Bought by
Pickering Helen R
Current Estimated Value
Home Financials for this Owner
Home Financials are based on the most recent Mortgage that was taken out on this home.
Original Mortgage
$80,655
Outstanding Balance
$47,218
Interest Rate
8.95%
Mortgage Type
Unknown
Estimated Equity
$103,255
Purchase Details
Closed on
Feb 14, 2002
Sold by
Jaracz Scott
Bought by
Noles Tony D
Home Financials for this Owner
Home Financials are based on the most recent Mortgage that was taken out on this home.
Original Mortgage
$71,362
Interest Rate
7.03%
Mortgage Type
FHA
Purchase Details
Closed on
May 1, 1995
Sold by
Zenoni Bradley A
Bought by
Jaracz Scott
Home Financials for this Owner
Home Financials are based on the most recent Mortgage that was taken out on this home.
Original Mortgage
$57,464
Interest Rate
8.42%
Mortgage Type
FHA
Create a Home Valuation Report for This Property
The Home Valuation Report is an in-depth analysis detailing your home's value as well as a comparison with similar homes in the area
Home Values in the Area
Average Home Value in this Area
Purchase History
| Date | Buyer | Sale Price | Title Company |
|---|---|---|---|
| Pickering Helen R | $85,000 | -- | |
| Noles Tony D | $72,000 | Chicago Title Insurance Co | |
| Jaracz Scott | $58,000 | -- |
Source: Public Records
Mortgage History
| Date | Status | Borrower | Loan Amount |
|---|---|---|---|
| Open | Pickering Helen R | $80,655 | |
| Previous Owner | Noles Tony D | $71,362 | |
| Previous Owner | Jaracz Scott | $57,464 |
Source: Public Records
Tax History Compared to Growth
Tax History
| Year | Tax Paid | Tax Assessment Tax Assessment Total Assessment is a certain percentage of the fair market value that is determined by local assessors to be the total taxable value of land and additions on the property. | Land | Improvement |
|---|---|---|---|---|
| 2024 | -- | $12,000 | $2,654 | $9,346 |
| 2023 | -- | $12,000 | $2,654 | $9,346 |
| 2022 | $0 | $5,501 | $2,464 | $3,037 |
| 2021 | $2,863 | $5,500 | $2,464 | $3,036 |
| 2020 | $2,885 | $5,500 | $2,464 | $3,036 |
| 2019 | $2,727 | $5,935 | $2,274 | $3,661 |
| 2018 | $2,622 | $5,935 | $2,274 | $3,661 |
| 2017 | $2,669 | $5,935 | $2,274 | $3,661 |
| 2016 | $2,966 | $5,480 | $2,085 | $3,395 |
| 2015 | $2,775 | $5,480 | $2,085 | $3,395 |
| 2014 | $2,746 | $5,480 | $2,085 | $3,395 |
| 2013 | $3,028 | $6,214 | $2,085 | $4,129 |
Source: Public Records
Map
Nearby Homes
- 332 Nokomis St
- 322 Nokomis St
- 329 Indianwood Blvd
- 366 Oswego St
- 348 Niagara St
- 326 Nassau St
- 340 Nassau St
- 357 Niagara St
- 343 Indianwood Blvd
- 337 Nassau St
- 358 Niagara St
- 340 Indianwood Blvd
- 357 Neola St
- 131 Sauk Trail
- 142 Marquette St
- 365 Oswego St
- 106 Blackhawk Dr
- 363 Indianwood Blvd
- 355 Oswego St
- 127 Blackhawk Dr