Estimated Value: $165,000 - $222,000
3
Beds
1
Bath
1,096
Sq Ft
$185/Sq Ft
Est. Value
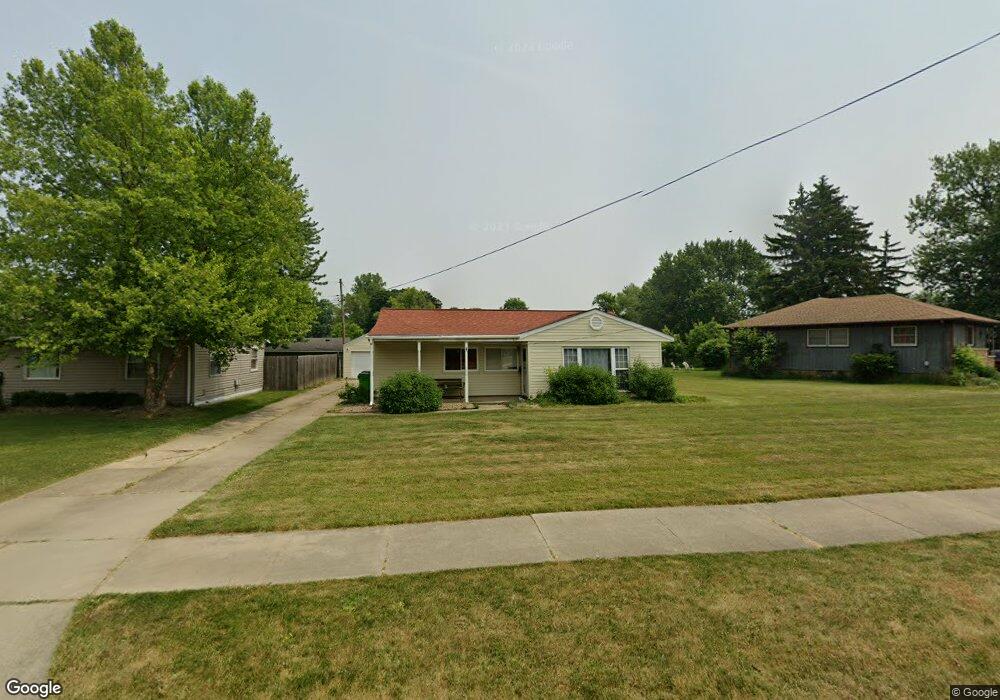
About This Home
This home is located at 338 Nobottom Rd, Berea, OH 44017 and is currently estimated at $202,783, approximately $185 per square foot. 338 Nobottom Rd is a home located in Cuyahoga County with nearby schools including Grindstone Elementary School, Berea-Midpark Middle School, and Berea-Midpark High School.
Ownership History
Date
Name
Owned For
Owner Type
Purchase Details
Closed on
Sep 16, 1996
Sold by
Marcin Barbara A
Bought by
Paulocsak Michael and Paulocsak Lynne E
Current Estimated Value
Home Financials for this Owner
Home Financials are based on the most recent Mortgage that was taken out on this home.
Original Mortgage
$84,918
Outstanding Balance
$7,350
Interest Rate
8.29%
Mortgage Type
FHA
Estimated Equity
$195,433
Purchase Details
Closed on
Nov 6, 1992
Sold by
Sears William J and Anna Marie
Bought by
Marcin Barbara A
Purchase Details
Closed on
Dec 17, 1986
Sold by
Hubler Dale
Bought by
Sears William J and Anna Marie
Purchase Details
Closed on
Jul 24, 1981
Sold by
Johnson Kenneth C
Bought by
Hubler Dale
Purchase Details
Closed on
Jul 14, 1980
Sold by
Kenneth C Johnson
Bought by
Johnson Kenneth C
Purchase Details
Closed on
Jan 1, 1975
Bought by
Johnson Elsa H
Create a Home Valuation Report for This Property
The Home Valuation Report is an in-depth analysis detailing your home's value as well as a comparison with similar homes in the area
Home Values in the Area
Average Home Value in this Area
Purchase History
| Date | Buyer | Sale Price | Title Company |
|---|---|---|---|
| Paulocsak Michael | $85,000 | -- | |
| Marcin Barbara A | $78,500 | -- | |
| Sears William J | $53,000 | -- | |
| Hubler Dale | $45,000 | -- | |
| Johnson Kenneth C | -- | -- | |
| Kenneth C Johnson | -- | -- | |
| Johnson Elsa H | -- | -- |
Source: Public Records
Mortgage History
| Date | Status | Borrower | Loan Amount |
|---|---|---|---|
| Open | Paulocsak Michael | $84,918 |
Source: Public Records
Tax History
| Year | Tax Paid | Tax Assessment Tax Assessment Total Assessment is a certain percentage of the fair market value that is determined by local assessors to be the total taxable value of land and additions on the property. | Land | Improvement |
|---|---|---|---|---|
| 2024 | $3,472 | $59,990 | $14,035 | $45,955 |
| 2023 | $3,160 | $45,750 | $11,940 | $33,810 |
| 2022 | $3,140 | $45,750 | $11,940 | $33,810 |
| 2021 | $3,113 | $45,750 | $11,940 | $33,810 |
| 2020 | $2,975 | $38,780 | $10,120 | $28,670 |
| 2019 | $2,896 | $110,800 | $28,900 | $81,900 |
| 2018 | $2,880 | $38,780 | $10,120 | $28,670 |
| 2017 | $2,837 | $35,460 | $8,610 | $26,850 |
| 2016 | $2,816 | $35,460 | $8,610 | $26,850 |
| 2015 | $2,801 | $35,460 | $8,610 | $26,850 |
| 2014 | $2,801 | $37,320 | $9,070 | $28,250 |
Source: Public Records
Map
Nearby Homes
- 428 Park Place
- 379 Laurel Dr
- 487 Karen Dr
- 452 N Rocky River Dr
- 446 Redwood Dr
- 445 Berea St
- 146 Marian Ln
- 160 Stonepointe Dr
- 404 Crescent Dr
- 160 Marian Ln Unit 6A
- 628 Lindbergh Blvd
- 93 W 5th Ave
- 725 Shakespeare Dr
- 41 W 5th Ave
- 211 W Bridge St
- 216 Kraft St
- 209 Gibson St
- 287 Edgewood Dr
- 300 West St
- 56 3rd Ave
- 344 Nobottom Rd
- 324 Nobottom Rd
- 294 Hickory Dr
- 350 Nobottom Rd
- 310 Nobottom Rd
- 300 Hickory Dr
- 323 Nobottom Rd
- 343 Nobottom Rd
- 333 Nobottom Rd
- 319 Lombardy Dr
- 347 Nobottom Rd
- 315 Lombardy Dr
- 283 Willow Ln
- 362 Nobottom Rd
- 317 Nobottom Rd
- 353 Nobottom Rd
- 309 Lombardy Dr
- 304 Nobottom Rd
- 339 Lombardy Dr
- 281 Willow Ln
Your Personal Tour Guide
Ask me questions while you tour the home.