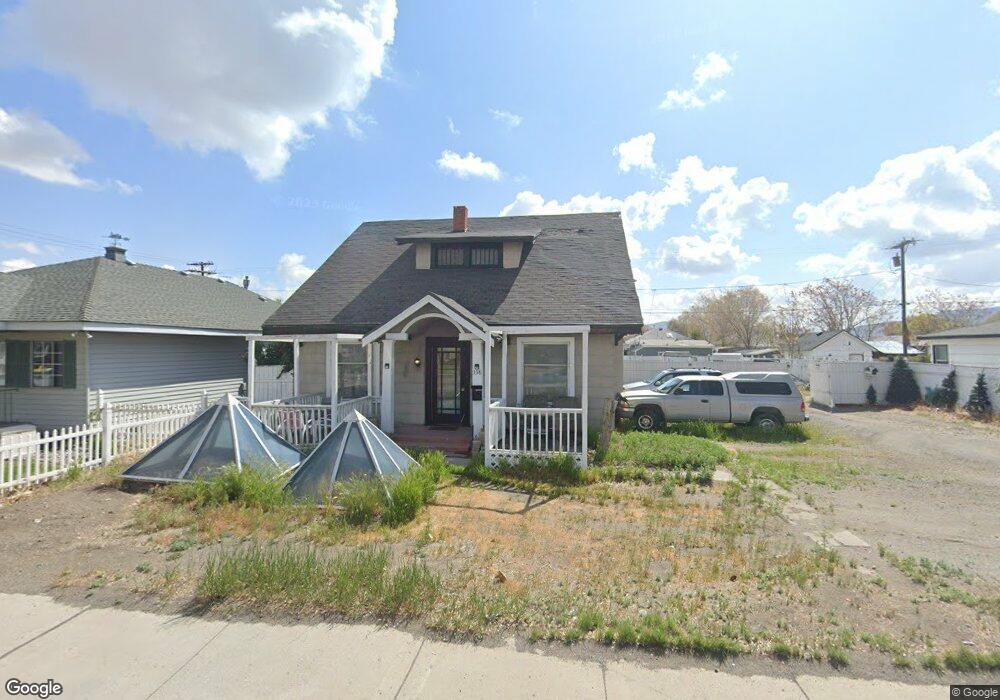
338 Pyramid Way Sparks, NV 89431
Downtown Sparks NeighborhoodEstimated Value: $441,895 - $619,000
5
Beds
2
Baths
2,325
Sq Ft
$229/Sq Ft
Est. Value
About This Home
This home is located at 338 Pyramid Way, Sparks, NV 89431 and is currently estimated at $533,474, approximately $229 per square foot. 338 Pyramid Way is a home located in Washoe County with nearby schools including Lincoln Park Elementary School, George L Dilworth Middle School, and Sparks High School.
Ownership History
Date
Name
Owned For
Owner Type
Purchase Details
Closed on
May 8, 2002
Sold by
Berry Hinckley Industries
Bought by
Johnson William M
Current Estimated Value
Home Financials for this Owner
Home Financials are based on the most recent Mortgage that was taken out on this home.
Original Mortgage
$63,000
Outstanding Balance
$26,271
Interest Rate
7.18%
Mortgage Type
Seller Take Back
Estimated Equity
$507,203
Create a Home Valuation Report for This Property
The Home Valuation Report is an in-depth analysis detailing your home's value as well as a comparison with similar homes in the area
Home Values in the Area
Average Home Value in this Area
Purchase History
| Date | Buyer | Sale Price | Title Company |
|---|---|---|---|
| Johnson William M | $93,000 | Western Title Inc |
Source: Public Records
Mortgage History
| Date | Status | Borrower | Loan Amount |
|---|---|---|---|
| Open | Johnson William M | $63,000 |
Source: Public Records
Tax History Compared to Growth
Tax History
| Year | Tax Paid | Tax Assessment Tax Assessment Total Assessment is a certain percentage of the fair market value that is determined by local assessors to be the total taxable value of land and additions on the property. | Land | Improvement |
|---|---|---|---|---|
| 2026 | $1,160 | $64,899 | $34,748 | $30,151 |
| 2025 | $1,374 | $67,582 | $37,548 | $30,034 |
| 2024 | $1,374 | $63,578 | $34,839 | $28,739 |
| 2023 | $1,274 | $62,037 | $35,375 | $26,663 |
| 2022 | $1,180 | $52,938 | $31,222 | $21,716 |
| 2021 | $1,093 | $45,271 | $24,106 | $21,165 |
| 2020 | $2,728 | $45,709 | $24,938 | $20,771 |
| 2019 | $979 | $40,914 | $21,347 | $19,567 |
| 2018 | $936 | $33,200 | $14,431 | $18,769 |
| 2017 | $2,253 | $31,746 | $13,300 | $18,446 |
| 2016 | $4,259 | $28,998 | $10,640 | $18,358 |
| 2015 | $874 | $25,549 | $7,648 | $17,901 |
| 2014 | $847 | $23,595 | $6,650 | $16,945 |
| 2013 | -- | $22,523 | $5,852 | $16,671 |
Source: Public Records
Map
Nearby Homes