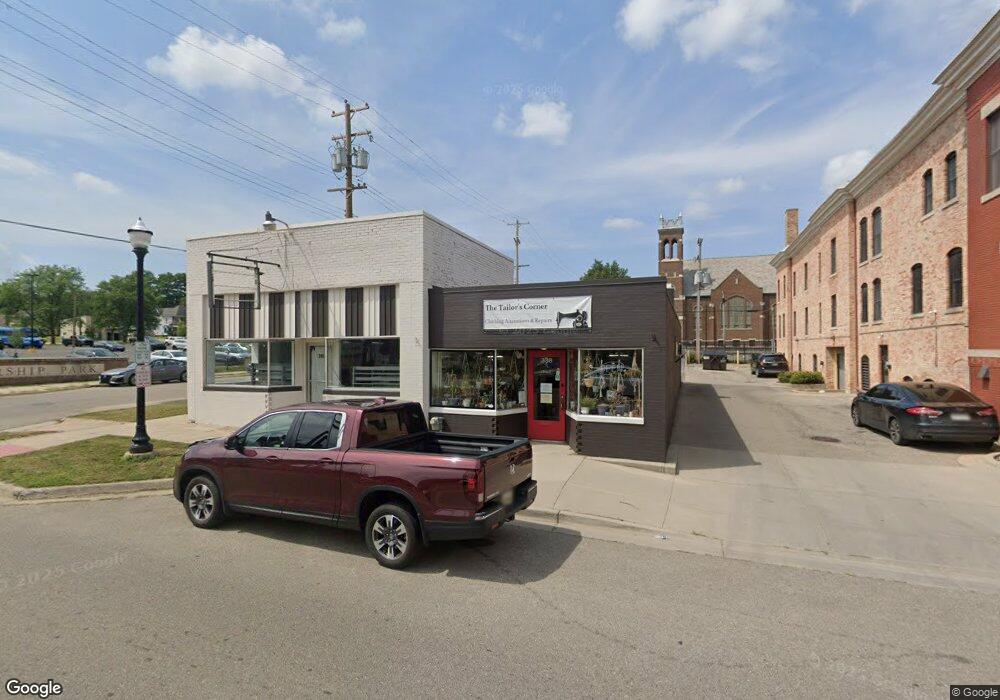
338 S Mechanic St Jackson, MI 49201
Downtown Jackson NeighborhoodEstimated Value: $135,310
Studio
3
Baths
2,752
Sq Ft
$49/Sq Ft
Est. Value
About This Home
This home is located at 338 S Mechanic St, Jackson, MI 49201 and is currently priced at $135,310, approximately $49 per square foot. 338 S Mechanic St is a home located in Jackson County with nearby schools including Middle School at Parkside, Jackson High School, and Francis Street Primary School.
Ownership History
Date
Name
Owned For
Owner Type
Purchase Details
Closed on
Mar 17, 2022
Sold by
Cha Myung-Kyung Angela and Hampton Myung-Kyung Angela
Bought by
Hampton Myung-Kyung Angela and Hampton Joshua
Current Estimated Value
Purchase Details
Closed on
Mar 15, 2022
Sold by
Cha Myung-Kyung Angela and Hampton Myung-Kyung Angela
Bought by
Hampton Myung-Kyung Angela and Hampton Joshua
Purchase Details
Closed on
Oct 8, 2020
Sold by
Brucy Donald E
Bought by
Cha Myungkyung A
Purchase Details
Closed on
Oct 7, 2020
Sold by
Bruey Mary H and Bruey Donald E
Bought by
Alfred J Brucey And Marie S Bruey Trust
Purchase Details
Closed on
Jun 5, 2017
Sold by
Bruey Alfred J and Bruey Marie S
Bought by
Bruey Alfred J and Bruey Marie S
Create a Home Valuation Report for This Property
The Home Valuation Report is an in-depth analysis detailing your home's value as well as a comparison with similar homes in the area
Home Values in the Area
Average Home Value in this Area
Purchase History
| Date | Buyer | Sale Price | Title Company |
|---|---|---|---|
| Hampton Myung-Kyung Angela | -- | -- | |
| Hampton Myung-Kyung Angela | -- | -- | |
| Cha Myungkyung A | $110,000 | None Available | |
| Alfred J Brucey And Marie S Bruey Trust | -- | None Available | |
| Bruey Alfred J | -- | Attorney | |
| Bruey Alfred J | -- | None Available |
Source: Public Records
Tax History
| Year | Tax Paid | Tax Assessment Tax Assessment Total Assessment is a certain percentage of the fair market value that is determined by local assessors to be the total taxable value of land and additions on the property. | Land | Improvement |
|---|---|---|---|---|
| 2025 | $3,418 | $57,500 | $0 | $0 |
| 2024 | $30 | $56,300 | $0 | $0 |
| 2023 | $2,849 | $53,800 | $0 | $0 |
| 2022 | $3,124 | $43,900 | $0 | $0 |
| 2021 | $3,405 | $46,850 | $0 | $0 |
| 2020 | $2,310 | $46,850 | $0 | $0 |
| 2019 | $2,125 | $41,350 | $0 | $0 |
| 2018 | $2,028 | $32,800 | $0 | $0 |
| 2017 | $1,863 | $30,050 | $0 | $0 |
| 2016 | $1,613 | $27,900 | $27,900 | $0 |
| 2015 | $1,886 | $28,800 | $28,800 | $0 |
| 2014 | $1,886 | $29,450 | $0 | $0 |
| 2013 | -- | $29,450 | $29,450 | $0 |
Source: Public Records
Map
Nearby Homes
- 109 W Washington Ave
- 109 W Washington Ave Unit 8
- 109 W Washington Ave Unit 16
- 109 W Washington Ave Unit 3
- 710 Martin Luther King Junior Dr
- 600 Greenwood Place
- 708 S Jackson St
- 939 Williams St
- 943 Williams St
- 1003 Williams St
- 357 Cooper St
- 1013 Maple Ave
- 0 Clinton St Unit 24055405
- 603 2nd St
- 135 Mitchell St
- 715 2nd St
- 1023 Maple Ave
- 315 E Trail St
- 1034 Williams St
- 1019 Woodbridge St
- 310 S Mechanic St
- 400 S Mechanic St
- 340 S Mechanic St Unit 1
- 401 S Mechanic St
- 401 S Mechanic St
- 401 S Mechanic St
- 401 S Mechanic St Unit 2
- 109 W Washington Ave Unit 18
- 109 W Washington Ave Unit 7
- 109 W Washington Ave Unit 3
- 109 W Washington Ave Unit 18
- 109 W Washington Ave
- 109 W Washington Ave
- 109 W Washington Ave
- 109 W Washington Ave
- 109 W Washington Ave
- 109 W Washington Ave
- 109 W Washington Ave Unit 20
- 109 W Washington Ave
- 109 W Washington Ave
Your Personal Tour Guide
Ask me questions while you tour the home.