Estimated Value: $140,000 - $160,000
3
Beds
1
Bath
816
Sq Ft
$185/Sq Ft
Est. Value
About This Home
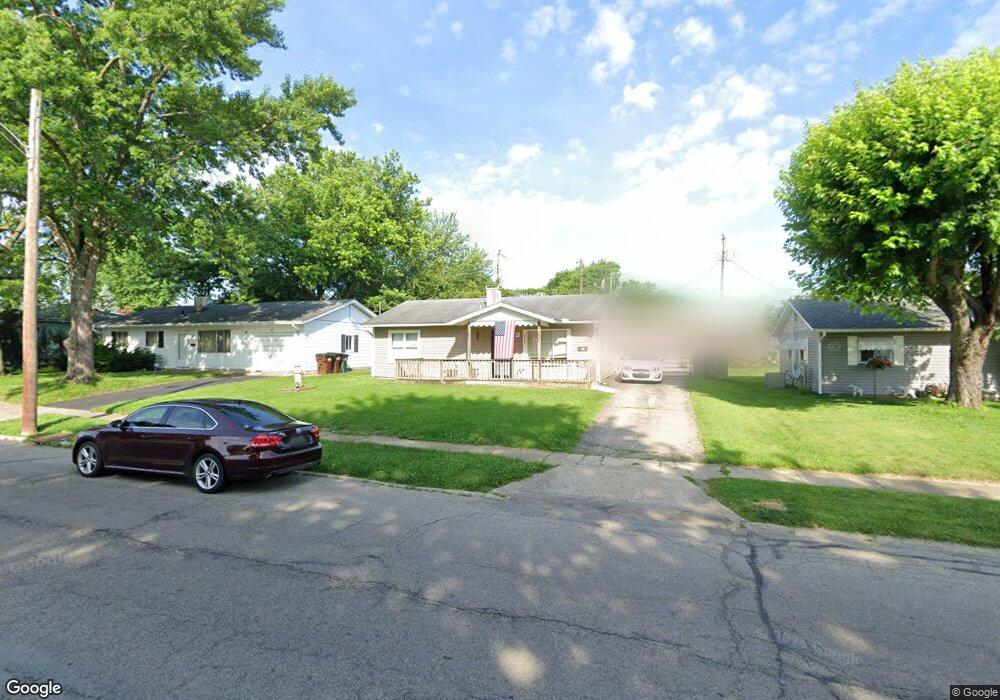
This home is located at 338 Sheelin Rd, Xenia, OH 45385 and is currently estimated at $150,612, approximately $184 per square foot. 338 Sheelin Rd is a home located in Greene County with nearby schools including Xenia High School, Summit Academy Community School for Alternative Learners - Xenia, and Legacy Christian Academy.
Ownership History
Date
Name
Owned For
Owner Type
Purchase Details
Closed on
Sep 7, 2018
Sold by
Estate Of Deborah L C Jordan
Bought by
Jordan Dennis K
Current Estimated Value
Purchase Details
Closed on
Aug 15, 2016
Sold by
Scottie E Hastings
Bought by
Jordan Deborah and Jordan Dennis
Home Financials for this Owner
Home Financials are based on the most recent Mortgage that was taken out on this home.
Original Mortgage
$34,500
Outstanding Balance
$27,500
Interest Rate
3.45%
Estimated Equity
$123,112
Purchase Details
Closed on
Jul 1, 2016
Bought by
Jordan Deborah L C
Home Financials for this Owner
Home Financials are based on the most recent Mortgage that was taken out on this home.
Original Mortgage
$34,500
Outstanding Balance
$27,500
Interest Rate
3.45%
Estimated Equity
$123,112
Purchase Details
Closed on
Nov 9, 2007
Sold by
Campbell Thomas Edward
Bought by
Jordan Deborah L C and Hastings Scottie Lee
Create a Home Valuation Report for This Property
The Home Valuation Report is an in-depth analysis detailing your home's value as well as a comparison with similar homes in the area
Home Values in the Area
Average Home Value in this Area
Purchase History
| Date | Buyer | Sale Price | Title Company |
|---|---|---|---|
| Jordan Dennis K | -- | None Available | |
| Jordan Deborah | -- | -- | |
| Jordan Deborah L C | -- | -- | |
| Jordan Deborah L C | -- | Attorney |
Source: Public Records
Mortgage History
| Date | Status | Borrower | Loan Amount |
|---|---|---|---|
| Open | Jordan Deborah | $34,500 | |
| Closed | Jordan Deborah | -- | |
| Closed | Jordan Deborah | -- |
Source: Public Records
Tax History Compared to Growth
Tax History
| Year | Tax Paid | Tax Assessment Tax Assessment Total Assessment is a certain percentage of the fair market value that is determined by local assessors to be the total taxable value of land and additions on the property. | Land | Improvement |
|---|---|---|---|---|
| 2024 | $1,527 | $35,680 | $9,020 | $26,660 |
| 2023 | $1,527 | $35,680 | $9,020 | $26,660 |
| 2022 | $1,260 | $25,110 | $6,440 | $18,670 |
| 2021 | $1,277 | $25,110 | $6,440 | $18,670 |
| 2020 | $1,223 | $25,110 | $6,440 | $18,670 |
| 2019 | $1,147 | $22,170 | $4,510 | $17,660 |
| 2018 | $1,152 | $22,170 | $4,510 | $17,660 |
| 2017 | $1,103 | $22,170 | $4,510 | $17,660 |
| 2016 | $1,104 | $20,850 | $4,510 | $16,340 |
| 2015 | $553 | $20,850 | $4,510 | $16,340 |
| 2014 | $1,060 | $20,850 | $4,510 | $16,340 |
Source: Public Records
Map
Nearby Homes
- 343 Sheelin Rd
- 1351 Omard Dr
- 912 Omard Dr
- 883 Omard Dr
- 1233 June Dr
- 1283 June Dr
- 1223 June Dr
- 509 Antrim Rd
- 1391 June Dr
- 1342 Kylemore Dr
- 613 N West St
- 121 S Progress Dr
- 1144 Rockwell Dr
- 305-325 Bellbrook Ave
- 137 Pleasant St
- 516 N King St
- 0 W Church St
- 659 N King St
- 878 N Detroit St
- 902 N Detroit St
- 350 Sheelin Rd
- 326 Sheelin Rd
- 1102 Richard Dr
- 1114 Richard Dr
- 364 Sheelin Rd
- 314 Sheelin Rd
- 1090 Richard Dr
- 1130 Richard Dr
- 376 Sheelin Rd
- 1074 Richard Dr
- 363 Sheelin Rd
- 1158 Stewart Ave
- 388 Sheelin Rd
- 1062 Richard Dr
- 375 Sheelin Rd
- 1157 Stewart Ave
- 1115 E Richard Dr
- 1089 Richard Dr
- 871 Dayton Ave
- 1146 Stewart Ave