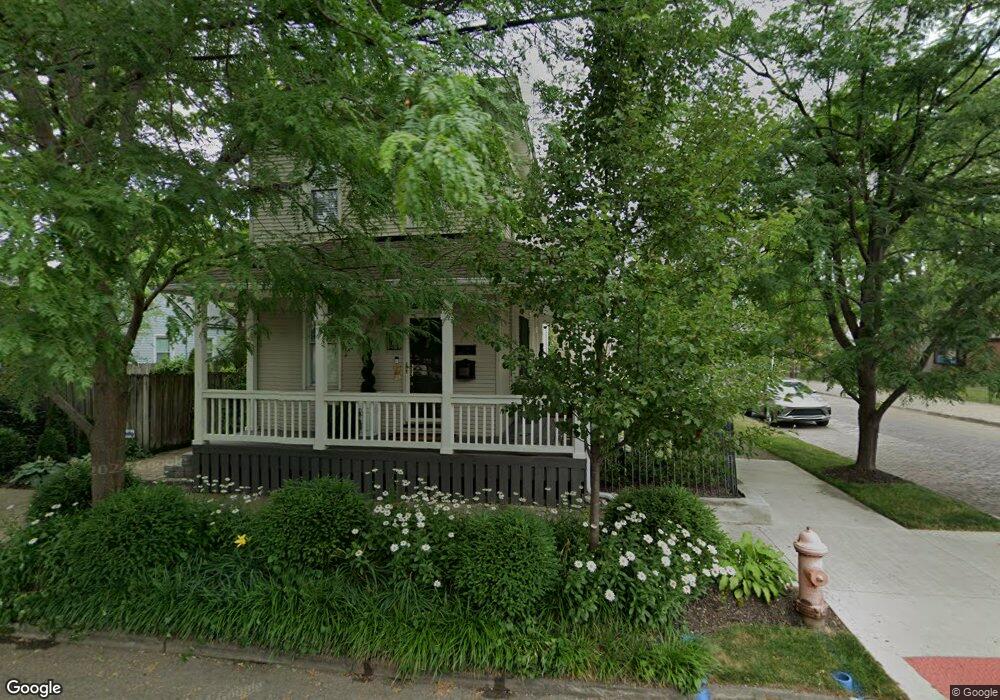
338 Siebert St Columbus, OH 43206
Schumacher Place NeighborhoodEstimated Value: $412,000 - $630,000
2
Beds
2
Baths
1,495
Sq Ft
$370/Sq Ft
Est. Value
About This Home
This home is located at 338 Siebert St, Columbus, OH 43206 and is currently estimated at $552,705, approximately $369 per square foot. 338 Siebert St is a home located in Franklin County with nearby schools including Siebert Elementary School, South High School, and South Columbus Preparatory Academy.
Ownership History
Date
Name
Owned For
Owner Type
Purchase Details
Closed on
Jun 4, 2014
Sold by
Misencik Brian J
Bought by
Misencik Brian J and Hite Kevin Wayne
Current Estimated Value
Home Financials for this Owner
Home Financials are based on the most recent Mortgage that was taken out on this home.
Original Mortgage
$174,900
Outstanding Balance
$49,827
Interest Rate
4.13%
Mortgage Type
Purchase Money Mortgage
Estimated Equity
$502,878
Purchase Details
Closed on
Jul 2, 2003
Sold by
Wolfenbarger Carol J and Wolfenbarger Guy
Bought by
Haller Thomas W and Haller Linda L
Home Financials for this Owner
Home Financials are based on the most recent Mortgage that was taken out on this home.
Original Mortgage
$158,300
Interest Rate
5.37%
Mortgage Type
Purchase Money Mortgage
Purchase Details
Closed on
May 2, 1994
Bought by
Wolfenbarger Carol J
Purchase Details
Closed on
Aug 1, 1983
Create a Home Valuation Report for This Property
The Home Valuation Report is an in-depth analysis detailing your home's value as well as a comparison with similar homes in the area
Home Values in the Area
Average Home Value in this Area
Purchase History
| Date | Buyer | Sale Price | Title Company |
|---|---|---|---|
| Misencik Brian J | $162,500 | None Available | |
| Haller Thomas W | $175,900 | Connor Land Title | |
| Wolfenbarger Carol J | -- | -- | |
| -- | -- | -- |
Source: Public Records
Mortgage History
| Date | Status | Borrower | Loan Amount |
|---|---|---|---|
| Open | Misencik Brian J | $174,900 | |
| Previous Owner | Haller Thomas W | $158,300 |
Source: Public Records
Tax History
| Year | Tax Paid | Tax Assessment Tax Assessment Total Assessment is a certain percentage of the fair market value that is determined by local assessors to be the total taxable value of land and additions on the property. | Land | Improvement |
|---|---|---|---|---|
| 2025 | $7,386 | $164,580 | $44,210 | $120,370 |
| 2024 | $7,386 | $164,580 | $44,210 | $120,370 |
| 2023 | $7,292 | $164,570 | $44,205 | $120,365 |
| 2022 | $9,229 | $177,950 | $62,270 | $115,680 |
| 2021 | $9,246 | $177,950 | $62,270 | $115,680 |
| 2020 | $9,258 | $177,950 | $62,270 | $115,680 |
| 2019 | $7,156 | $117,960 | $62,270 | $55,690 |
| 2018 | $6,440 | $117,960 | $62,270 | $55,690 |
| 2017 | $6,737 | $117,960 | $62,270 | $55,690 |
| 2016 | $6,323 | $95,450 | $24,360 | $71,090 |
| 2015 | $5,740 | $95,450 | $24,360 | $71,090 |
| 2014 | $5,754 | $95,450 | $24,360 | $71,090 |
| 2013 | $2,580 | $86,765 | $22,155 | $64,610 |
Source: Public Records
Map
Nearby Homes
- 1010 Bruck St
- 243 E Whittier St Unit 245
- 472 E Whittier St
- 432 E Kossuth St
- 253 E Kossuth St Unit 253-H
- 395 E Deshler Ave
- 497 E Kossuth St
- 259 Thurman Ave
- 1106-1116 Parsons Ave
- 135 E Whittier St
- 247-249 Thurman Ave
- 530 Stewart Ave
- 136 E Whittier St
- 510 Cline St
- 512 Cline St
- 514 Cline St
- 516 Cline St
- 320 E Mithoff St
- 332 E Mithoff St
- 169 Thurman Ave Unit 169
- 330 Siebert St
- 326 Siebert St
- 339 Reinhard Ave
- 343 Reinhard Ave
- 335 Reinhard Ave
- 331 Reinhard Ave
- 327 Reinhard Ave
- 327 Siebert St
- 318 Siebert St
- 349 Siebert St
- 323 Reinhard Ave
- 347 Siebert St Unit 349
- 314 Siebert St
- 321 Siebert St
- 351 Siebert St
- 317 Reinhard Ave
- 325 Siebert St
- 353 Siebert St
- 344 Reinhard Ave
- 312 Siebert St
Your Personal Tour Guide
Ask me questions while you tour the home.