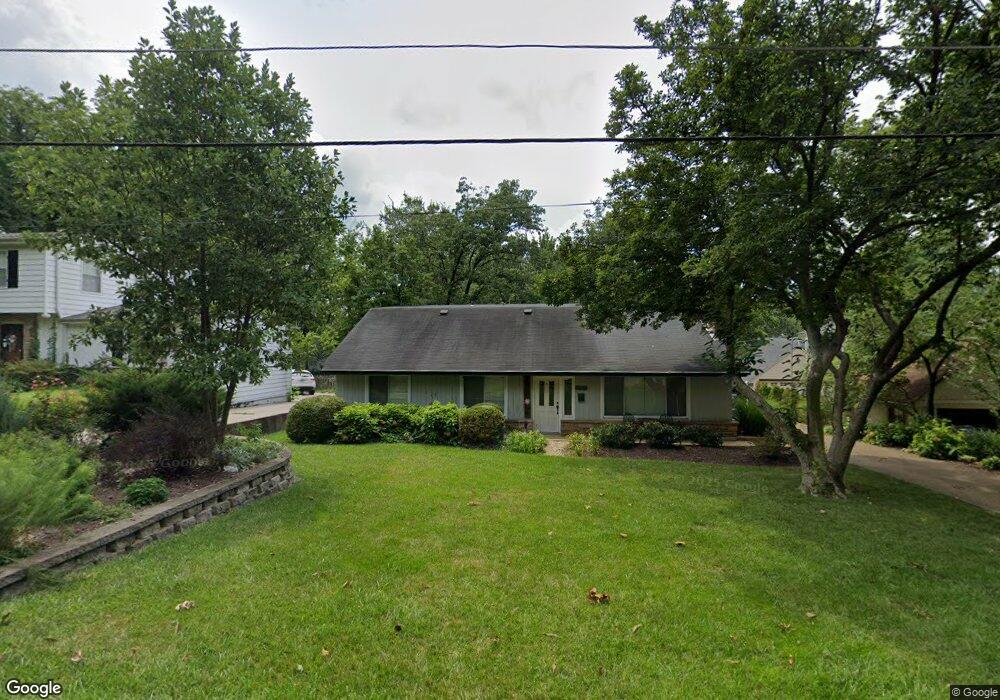
338 Simmons Ave Saint Louis, MO 63119
Estimated Value: $400,000 - $711,000
3
Beds
3
Baths
2,458
Sq Ft
$238/Sq Ft
Est. Value
About This Home
This home is located at 338 Simmons Ave, Saint Louis, MO 63119 and is currently estimated at $585,886, approximately $238 per square foot. 338 Simmons Ave is a home located in St. Louis County with nearby schools including Clark Elementary School, Hixson Middle School, and Webster Groves High School.
Ownership History
Date
Name
Owned For
Owner Type
Purchase Details
Closed on
Dec 27, 2017
Sold by
Neidenbach Geoffrey A and Taylor Chelsea L
Bought by
Neidenbach Geoffrey A and Taylor Chelsea L
Current Estimated Value
Home Financials for this Owner
Home Financials are based on the most recent Mortgage that was taken out on this home.
Original Mortgage
$170,000
Outstanding Balance
$119,308
Interest Rate
3.93%
Mortgage Type
Future Advance Clause Open End Mortgage
Estimated Equity
$466,578
Purchase Details
Closed on
May 17, 2012
Sold by
U S Bank National Association
Bought by
Neidenbach Geoff
Home Financials for this Owner
Home Financials are based on the most recent Mortgage that was taken out on this home.
Original Mortgage
$186,000
Interest Rate
3.8%
Mortgage Type
Construction
Purchase Details
Closed on
Jan 13, 2012
Sold by
Adams David H and Adams Terri L
Bought by
U S Bank National Association
Purchase Details
Closed on
Jul 1, 1997
Sold by
Petersen Allene B Trs
Bought by
Adams David H and Adams Terri L
Home Financials for this Owner
Home Financials are based on the most recent Mortgage that was taken out on this home.
Original Mortgage
$123,200
Interest Rate
7.37%
Create a Home Valuation Report for This Property
The Home Valuation Report is an in-depth analysis detailing your home's value as well as a comparison with similar homes in the area
Home Values in the Area
Average Home Value in this Area
Purchase History
| Date | Buyer | Sale Price | Title Company |
|---|---|---|---|
| Neidenbach Geoffrey A | -- | Investors Title Co Clayton | |
| Neidenbach Geoff | $157,500 | Continental Title Company | |
| U S Bank National Association | $158,851 | None Available | |
| Adams David H | -- | -- |
Source: Public Records
Mortgage History
| Date | Status | Borrower | Loan Amount |
|---|---|---|---|
| Open | Neidenbach Geoffrey A | $170,000 | |
| Closed | Neidenbach Geoff | $186,000 | |
| Previous Owner | Adams David H | $123,200 |
Source: Public Records
Tax History Compared to Growth
Tax History
| Year | Tax Paid | Tax Assessment Tax Assessment Total Assessment is a certain percentage of the fair market value that is determined by local assessors to be the total taxable value of land and additions on the property. | Land | Improvement |
|---|---|---|---|---|
| 2025 | $6,035 | $105,460 | $52,350 | $53,110 |
| 2024 | $6,035 | $86,820 | $38,080 | $48,740 |
| 2023 | $6,005 | $86,820 | $38,080 | $48,740 |
| 2022 | $5,631 | $75,570 | $38,080 | $37,490 |
| 2021 | $5,611 | $75,570 | $38,080 | $37,490 |
| 2020 | $6,092 | $76,480 | $38,020 | $38,460 |
| 2019 | $6,048 | $76,480 | $38,020 | $38,460 |
| 2018 | $5,513 | $61,870 | $26,620 | $35,250 |
| 2017 | $5,476 | $61,870 | $26,620 | $35,250 |
| 2016 | $3,521 | $37,910 | $22,820 | $15,090 |
| 2015 | $3,533 | $37,910 | $22,820 | $15,090 |
| 2014 | $3,187 | $33,250 | $16,340 | $16,910 |
Source: Public Records
Map
Nearby Homes
- 514 S Gore Ave
- 340 Gray Ave
- 368 S Gore Ave
- 1139 Hawken Place Unit 6
- 200 Blackmer Place
- 432 Reavis Place Unit 20
- 600 S Berry Rd
- 144 S Rock Hill Rd
- 156 Gray Ave
- 426 S Maple Ave
- 12 Webster Acres
- 147 Firwood Dr
- 125 E Frisco Ave
- 134 Firwood Dr
- 127 Webster Woods Dr
- 26 Webster Oaks Dr
- 203 E Jackson Rd
- 1316 Webster Forest Ct
- 1353 Webster Path Dr
- 30 Webster Oaks Dr
- 332 Simmons Ave
- 550 S Rock Hill Rd
- 562 S Rock Hill Rd
- 335 Baker Ave
- 326 Simmons Ave
- 331 Baker Ave
- 327 Baker Ave
- 570 S Rock Hill Rd
- 331 Simmons Ave
- 540 S Rock Hill Rd
- 323 Baker Ave
- 539 S Rock Hill Rd
- 318 Simmons Ave
- 325 Simmons Ave
- 403 Baker Ave
- 319 Baker Ave
- 323 Simmons Ave
- 533 S Rock Hill Rd
- 334 Baker Ave
- 600 S Rock Hill Rd