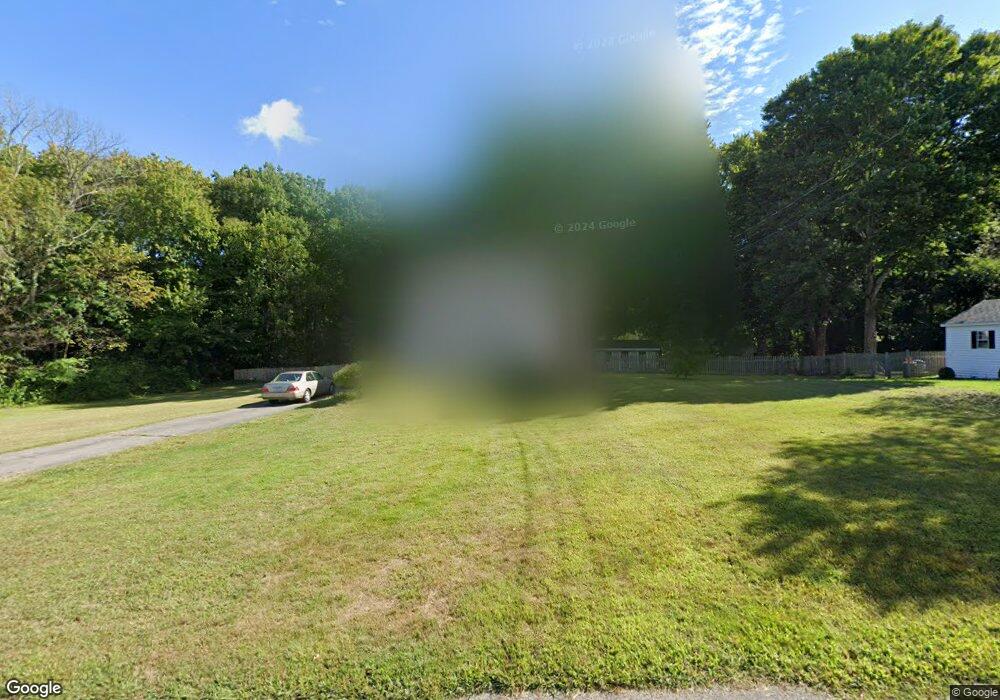
338 Stone St Walpole, MA 02081
Estimated Value: $629,000 - $705,000
3
Beds
1
Bath
1,158
Sq Ft
$572/Sq Ft
Est. Value
About This Home
This home is located at 338 Stone St, Walpole, MA 02081 and is currently estimated at $662,525, approximately $572 per square foot. 338 Stone St is a home located in Norfolk County with nearby schools including Boyden School, Eleanor N. Johnson Middle School, and Walpole High School.
Ownership History
Date
Name
Owned For
Owner Type
Purchase Details
Closed on
Oct 11, 2000
Sold by
Wronski Edmond J and Wronski Dorothy M
Bought by
Simons Richard T and Simons Michelle T
Current Estimated Value
Home Financials for this Owner
Home Financials are based on the most recent Mortgage that was taken out on this home.
Original Mortgage
$236,000
Interest Rate
7.78%
Create a Home Valuation Report for This Property
The Home Valuation Report is an in-depth analysis detailing your home's value as well as a comparison with similar homes in the area
Home Values in the Area
Average Home Value in this Area
Purchase History
| Date | Buyer | Sale Price | Title Company |
|---|---|---|---|
| Simons Richard T | $255,000 | -- |
Source: Public Records
Mortgage History
| Date | Status | Borrower | Loan Amount |
|---|---|---|---|
| Open | Simons Richard T | $50,000 | |
| Open | Simons Richard T | $236,000 | |
| Closed | Simons Richard T | $236,000 | |
| Closed | Simons Richard T | $236,000 |
Source: Public Records
Tax History
| Year | Tax Paid | Tax Assessment Tax Assessment Total Assessment is a certain percentage of the fair market value that is determined by local assessors to be the total taxable value of land and additions on the property. | Land | Improvement |
|---|---|---|---|---|
| 2025 | $7,495 | $584,200 | $349,200 | $235,000 |
| 2024 | $7,296 | $551,900 | $336,000 | $215,900 |
| 2023 | $7,062 | $508,400 | $292,000 | $216,400 |
| 2022 | $6,663 | $460,800 | $270,300 | $190,500 |
| 2021 | $6,359 | $428,500 | $255,000 | $173,500 |
| 2020 | $6,356 | $424,000 | $240,500 | $183,500 |
| 2019 | $6,052 | $400,800 | $231,300 | $169,500 |
| 2018 | $5,668 | $371,200 | $222,400 | $148,800 |
| 2017 | $5,480 | $357,500 | $213,900 | $143,600 |
| 2016 | $5,233 | $336,300 | $207,800 | $128,500 |
| 2015 | $5,074 | $323,200 | $198,300 | $124,900 |
| 2014 | $4,906 | $311,300 | $198,300 | $113,000 |
Source: Public Records
Map
Nearby Homes
- 224 School St Unit 9
- 222 School St Unit 9
- 145 South St Unit 5
- 1110 Main St
- 587 Common St
- 635 Old Post Rd Unit 303
- 635 Old Post Rd Unit 302
- 881 Main St Unit 9
- 1 Palace Ct
- 1 Providence Hwy
- 56 North St
- 1391 Main St Unit 308
- 1391 Main St Unit 306
- 1391 Main St Unit 304
- 486 Washington St
- 0 U S Route 1
- 127 Clear Pond Dr
- 41 Gill St Unit A
- 667 South St
- 137 Clear Pond Dr