Estimated Value: $358,000 - $463,000
4
Beds
3
Baths
2,900
Sq Ft
$139/Sq Ft
Est. Value
About This Home
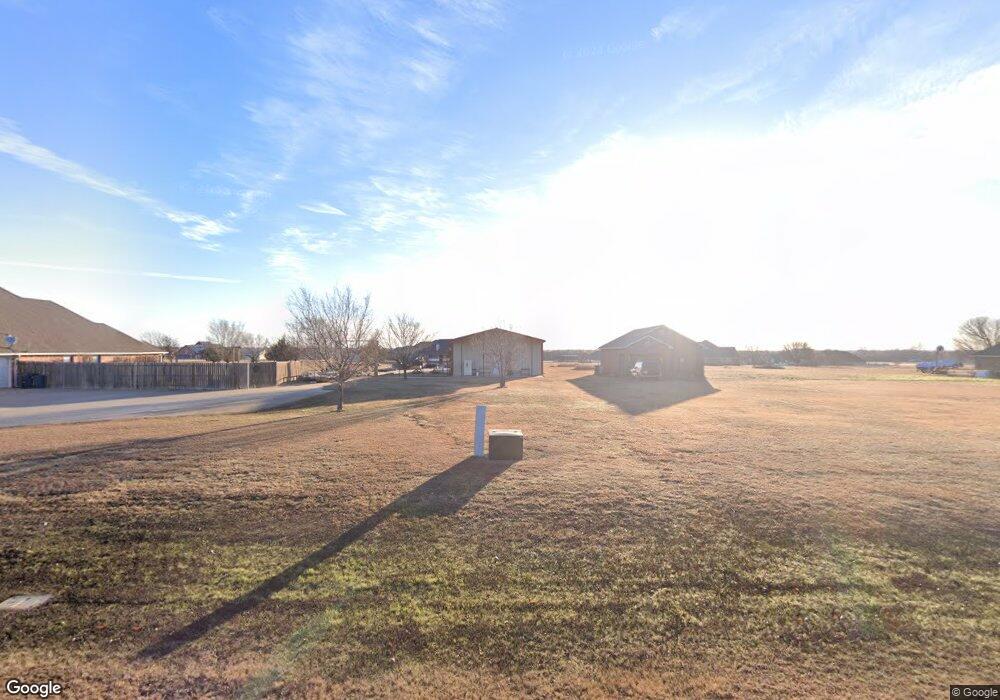
This home is located at 338 SW 154th St, Cache, OK 73527 and is currently estimated at $404,446, approximately $139 per square foot. 338 SW 154th St is a home located in Comanche County with nearby schools including Cache Primary Elementary School, Cache Intermediate Elementary School, and Cache Middle School.
Ownership History
Date
Name
Owned For
Owner Type
Purchase Details
Closed on
Jul 6, 2009
Sold by
Oweans Steven W and Oweans Chorthip
Bought by
Ragan Nancy T and Regan Michael A
Current Estimated Value
Home Financials for this Owner
Home Financials are based on the most recent Mortgage that was taken out on this home.
Original Mortgage
$200,000
Outstanding Balance
$128,916
Interest Rate
5.39%
Mortgage Type
New Conventional
Estimated Equity
$275,530
Purchase Details
Closed on
Feb 24, 2006
Sold by
Tongson Tedj J and Tongson Rachel C
Bought by
Owens Steven W and Owens Chorthip
Home Financials for this Owner
Home Financials are based on the most recent Mortgage that was taken out on this home.
Original Mortgage
$204,000
Interest Rate
6.05%
Mortgage Type
New Conventional
Purchase Details
Closed on
Jun 22, 2004
Sold by
Peck John
Purchase Details
Closed on
Nov 24, 2003
Sold by
Matthey William Alan
Purchase Details
Closed on
Oct 16, 1997
Sold by
Matthey William Alan and Matthey Paige
Create a Home Valuation Report for This Property
The Home Valuation Report is an in-depth analysis detailing your home's value as well as a comparison with similar homes in the area
Purchase History
| Date | Buyer | Sale Price | Title Company |
|---|---|---|---|
| Ragan Nancy T | $270,000 | -- | |
| Owens Steven W | $255,000 | -- | |
| -- | -- | -- | |
| -- | $27,000 | -- | |
| -- | -- | -- |
Source: Public Records
Mortgage History
| Date | Status | Borrower | Loan Amount |
|---|---|---|---|
| Open | Ragan Nancy T | $200,000 | |
| Previous Owner | Owens Steven W | $204,000 |
Source: Public Records
Tax History
| Year | Tax Paid | Tax Assessment Tax Assessment Total Assessment is a certain percentage of the fair market value that is determined by local assessors to be the total taxable value of land and additions on the property. | Land | Improvement |
|---|---|---|---|---|
| 2025 | $4,416 | $41,512 | $4,698 | $36,814 |
| 2024 | $4,266 | $41,512 | $5,124 | $36,388 |
| 2023 | $4,266 | $37,653 | $2,683 | $34,970 |
| 2022 | $4,035 | $35,860 | $2,683 | $33,177 |
| 2021 | $3,329 | $35,718 | $2,683 | $33,035 |
| 2020 | $3,961 | $39,071 | $2,683 | $36,388 |
| 2019 | $3,804 | $37,299 | $2,683 | $34,616 |
| 2018 | $3,665 | $35,523 | $2,683 | $32,840 |
| 2017 | $3,378 | $33,831 | $2,683 | $31,148 |
| 2016 | $3,163 | $32,220 | $2,683 | $29,537 |
| 2015 | $3,006 | $30,686 | $2,683 | $28,003 |
| 2014 | $2,824 | $29,225 | $2,683 | $26,542 |
Source: Public Records
Map
Nearby Homes
- 357 SW Matthey Dr
- 621 SW Eden Place
- 147 SW Elk Creek Loop
- 168 SW Crater Creek Rd
- 17168 W Gore Blvd
- 33 NW Heatherstone Dr
- 207 & 1/2 N Crater Creek Rd
- 817 Hummingbird Dr
- 114 NW Sandy Trail Cir
- 209 E B Ave
- 7020 SW Deyo Mission Rd
- 12 NW Valley Ridge Dr
- 11 NW Forest Place
- 207 C Ave
- 703 SW 6th
- 433 NE Creekside Dr
- 1 NW Bent Tree Cir
- 11 NW Deer Run Trail
- 405 N Mountain Meadow Dr
- 414 NW Granite Ave
- 353 SW 154th St
- 217 SW Quail Springs Dr
- 416 SW 154th St
- 65 SW Quail Springs Ln
- 387 SW 154th St
- 307 SW 154th St
- 50 SW Matthey Dr
- 293 SW Quail Springs Dr
- 165 SW Quail Springs Dr
- 1 SW Matthey Dr
- 413 SW 154th St
- 214 SW Quail Springs Dr
- 66 SW Quail Springs Ln
- 66 SW Quail Springs Ln
- 455 SW 154th St
- 51 SW Matthey Dr
- 343 SW Quail Springs Dr
- 343 SW Quail Springs Dr
- 211 SW 154th St
- 164 SW Matthey Dr
Your Personal Tour Guide
Ask me questions while you tour the home.