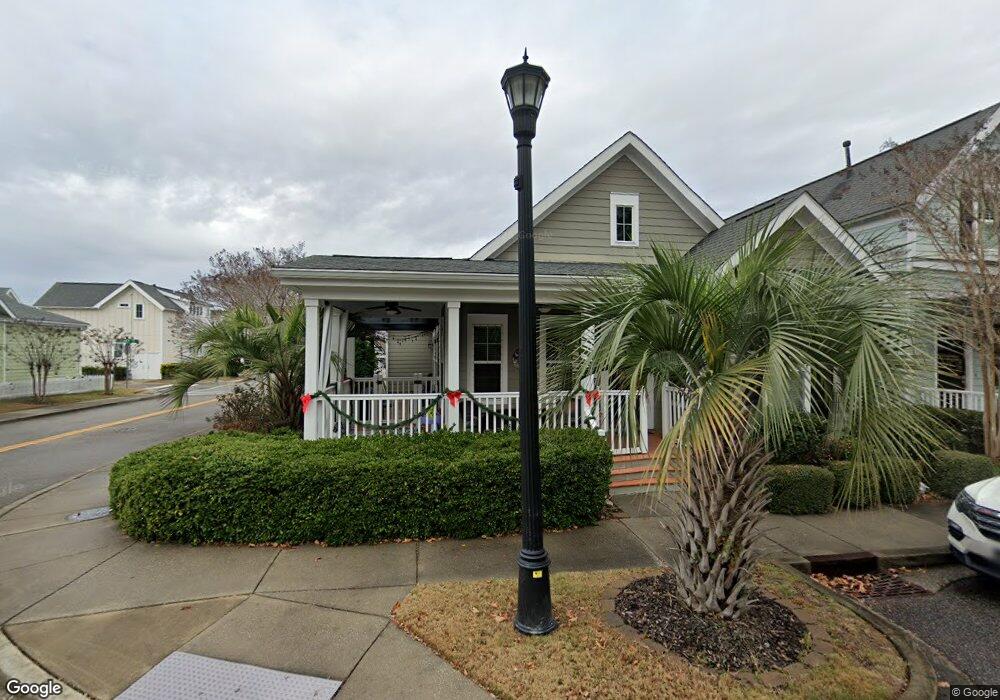
3380 Baldwin Ln Unit Lexington Myrtle Beach, SC 29577
Market Commons NeighborhoodEstimated Value: $503,150 - $539,000
3
Beds
3
Baths
2,350
Sq Ft
$220/Sq Ft
Est. Value
About This Home
This home is located at 3380 Baldwin Ln Unit Lexington, Myrtle Beach, SC 29577 and is currently estimated at $518,038, approximately $220 per square foot. 3380 Baldwin Ln Unit Lexington is a home located in Horry County with nearby schools including Myrtle Beach Child Development Center, Myrtle Beach Primary School, and Myrtle Beach Elementary School.
Ownership History
Date
Name
Owned For
Owner Type
Purchase Details
Closed on
Dec 13, 2013
Sold by
Crass Crass Ellen M Ellen M and Crass Howard J
Bought by
Molloy John A and Molloy Mary J
Current Estimated Value
Home Financials for this Owner
Home Financials are based on the most recent Mortgage that was taken out on this home.
Original Mortgage
$206,500
Interest Rate
4.38%
Mortgage Type
Future Advance Clause Open End Mortgage
Purchase Details
Closed on
Oct 11, 2012
Sold by
Crass Ellen M
Bought by
Crass Ellen M
Purchase Details
Closed on
Apr 28, 2011
Sold by
Dockstreet At The Market Common Inc
Bought by
Crass Howard J
Purchase Details
Closed on
Jan 13, 2011
Sold by
Lukmb2 Llc
Bought by
Dockstreet At The Market Common Inc
Create a Home Valuation Report for This Property
The Home Valuation Report is an in-depth analysis detailing your home's value as well as a comparison with similar homes in the area
Home Values in the Area
Average Home Value in this Area
Purchase History
| Date | Buyer | Sale Price | Title Company |
|---|---|---|---|
| Molloy John A | $295,000 | -- | |
| Crass Ellen M | -- | -- | |
| Crass Howard J | $292,581 | -- | |
| Dockstreet At The Market Common Inc | $40,000 | -- |
Source: Public Records
Mortgage History
| Date | Status | Borrower | Loan Amount |
|---|---|---|---|
| Previous Owner | Molloy John A | $206,500 |
Source: Public Records
Tax History Compared to Growth
Tax History
| Year | Tax Paid | Tax Assessment Tax Assessment Total Assessment is a certain percentage of the fair market value that is determined by local assessors to be the total taxable value of land and additions on the property. | Land | Improvement |
|---|---|---|---|---|
| 2024 | $1,304 | $18,822 | $5,061 | $13,761 |
| 2023 | $1,304 | $12,713 | $3,005 | $9,708 |
| 2021 | $1,170 | $12,760 | $3,052 | $9,708 |
| 2020 | $1,012 | $12,760 | $3,052 | $9,708 |
| 2019 | $973 | $12,760 | $3,052 | $9,708 |
| 2018 | $870 | $11,055 | $1,967 | $9,088 |
| 2017 | $845 | $11,055 | $1,967 | $9,088 |
| 2016 | -- | $11,055 | $1,967 | $9,088 |
| 2015 | $838 | $11,056 | $1,968 | $9,088 |
| 2014 | -- | $11,056 | $1,968 | $9,088 |
Source: Public Records
Map
Nearby Homes
- 3385 Pampas Dr
- 3400 Pampas Dr
- 3448 Baldwin Ln
- 3452 Baldwin Ln
- 736 Satterwhite Way
- 754 Murray Ave
- 718 Shine Ave
- 813 Pancho St
- 750 Howard Ave Unit E
- 804 Shine Ave
- 830 Howard Ave Unit D
- 3523 Chestnut Dr
- 800 Curtis Brown Ln
- 1411 Peterson St
- 763 Moen Place Unit 763-B
- 3526 Evergreen Way Unit 3526
- 3530 Evergreen Way
- 3555 Chestnut Dr Unit 1403
- 780 Gabreski Ln Unit A-2
- 2794 Howard Ave Unit A
- 3380 Baldwin Ln
- 3376 Baldwin Ln Unit Calhoun
- 3376 Baldwin Ln
- 3372 Baldwin Ln
- 3410 Baldwin Ln Unit MARKET COMMON
- 3410 Baldwin Ln
- 660 Johnson Ave Unit King Street Cottage
- 660 Johnson Ave
- 3368 Baldwin Ln
- 664 Johnson Ave
- 3420 Branch St Unit Quarters
- 3420 Branch St
- 670 Johnson Ave
- 3364 Baldwin Ln
- 3364 Baldwin Ln Unit Verdier
- 3418 Baldwin Ln Unit Colleton 2
- 3418 Baldwin Ln
- 3424 Branch St
- 676 Johnson Ave Unit King Street Cottage
- 3421 Thrash Way