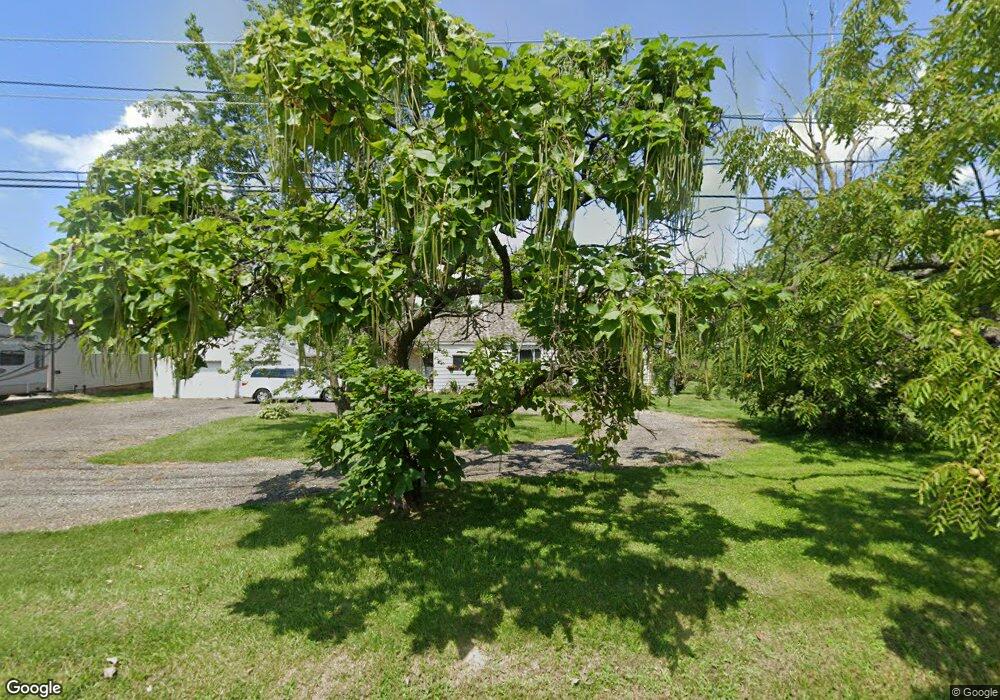
3380 Orders Rd Grove City, OH 43123
Estimated Value: $304,550 - $384,000
2
Beds
1
Bath
1,294
Sq Ft
$268/Sq Ft
Est. Value
About This Home
This home is located at 3380 Orders Rd, Grove City, OH 43123 and is currently estimated at $346,388, approximately $267 per square foot. 3380 Orders Rd is a home with nearby schools including Hayes Intermediate School, Jc Sommer Elementary School, and Jackson Middle School.
Ownership History
Date
Name
Owned For
Owner Type
Purchase Details
Closed on
Feb 14, 2023
Sold by
Gainer Marion C and Gainer Fanny Lane
Bought by
Marion C Gainer And Fanny L Gainer Joint Trus
Current Estimated Value
Purchase Details
Closed on
Feb 2, 2023
Sold by
Gainer Fanny Lane
Bought by
Marion C Gainer And Fanny L Gainer Joint Trus
Purchase Details
Closed on
Jan 26, 2023
Sold by
Rogers Henry Dale and Rogers Ruth Karen
Bought by
Gainer Marion C and Gainer Fanny Lane
Purchase Details
Closed on
Dec 30, 1997
Sold by
Rogers Ferman Ray
Bought by
Gainer Marion C and Gainer Fanny L
Purchase Details
Closed on
Jun 15, 1994
Sold by
Rogers Henry Dale and Rogers Ruth Karen
Bought by
Gainer Marion C and Gainer Fanny Lane
Purchase Details
Closed on
Jun 12, 1989
Bought by
Gainer Fanny L Et Al 5
Purchase Details
Closed on
Dec 1, 1986
Purchase Details
Closed on
Jul 1, 1983
Create a Home Valuation Report for This Property
The Home Valuation Report is an in-depth analysis detailing your home's value as well as a comparison with similar homes in the area
Home Values in the Area
Average Home Value in this Area
Purchase History
| Date | Buyer | Sale Price | Title Company |
|---|---|---|---|
| Marion C Gainer And Fanny L Gainer Joint Trus | -- | -- | |
| Marion C Gainer And Fanny L Gainer Joint Trus | $6,000 | -- | |
| Marion C Gainer And Fanny L Gainer Joint Trus | -- | -- | |
| Gainer Marion C | $6,000 | -- | |
| Gainer Marion C | $6,000 | -- | |
| Gainer Marion C | $6,000 | None Listed On Document | |
| Gainer Fanny L Et Al 5 | $6,000 | -- | |
| -- | $5,800 | -- | |
| -- | -- | -- |
Source: Public Records
Tax History Compared to Growth
Tax History
| Year | Tax Paid | Tax Assessment Tax Assessment Total Assessment is a certain percentage of the fair market value that is determined by local assessors to be the total taxable value of land and additions on the property. | Land | Improvement |
|---|---|---|---|---|
| 2024 | $3,483 | $76,800 | $28,880 | $47,920 |
| 2023 | $3,248 | $75,960 | $28,880 | $47,080 |
| 2022 | $3,238 | $54,610 | $24,260 | $30,350 |
| 2021 | $3,303 | $54,610 | $24,260 | $30,350 |
| 2020 | $3,293 | $54,610 | $24,260 | $30,350 |
| 2019 | $2,933 | $44,870 | $20,230 | $24,640 |
| 2018 | $2,983 | $44,870 | $20,230 | $24,640 |
| 2017 | $3,196 | $44,870 | $20,230 | $24,640 |
| 2016 | $3,333 | $42,670 | $22,440 | $20,230 |
| 2015 | $3,043 | $42,670 | $22,440 | $20,230 |
| 2014 | $3,045 | $42,670 | $22,440 | $20,230 |
| 2013 | $1,366 | $40,600 | $21,350 | $19,250 |
Source: Public Records
Map
Nearby Homes
- 3027 Mckinney Rd
- 2994 Darby Downs Rd
- 2997 Darby Downs Rd
- 3004 Darby Downs Rd
- 3057 Mckinney Rd
- 3022 Darby Downs Rd
- 3030 Darby Downs Rd
- 3215 Farmhouse Ln
- 3046 Darby Downs Rd
- 5148 Keefer Ln
- 3171 Orders Rd
- 4879 Blossom Way Unit 41
- 5124 Keefer Ln
- 2750 Longridge Way
- 3022 Crabapple Place Unit 4
- 2720 Loris Way
- 3207 Farmhouse Ln
- 3223 Farmhouse Ln
- 4838 Adwell Loop
- 3234 Callie Marie Dr
- 3370 Orders Rd
- 3400 Orders Rd
- 3350 Orders Rd
- 3420 Orders Rd
- 3437 Orders Rd
- 3436 Orders Rd
- 3449 Orders Rd
- 3452 Orders Rd
- 3314 Orders Rd
- 3509 Orders Rd
- 3296 Orders Rd
- 3523 Orders Rd
- 3524 Orders Rd
- 3529 Orders Rd
- 3280 Orders Rd
- 5070 Haughn Rd
- 3535 Orders Rd
- 3270 Orders Rd
- 5050 Haughn Rd
- 5055 Apple Glen Trail Unit 76