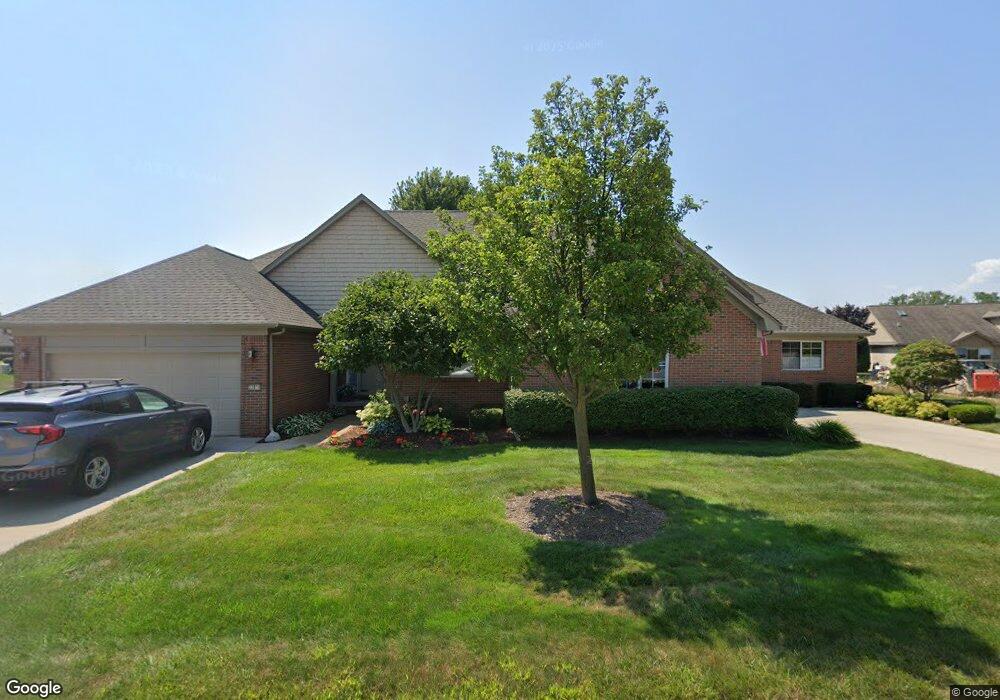
33818 Au Sable Dr Unit 33 Chesterfield, MI 48047
Estimated Value: $319,098 - $406,000
2
Beds
2
Baths
1,608
Sq Ft
$228/Sq Ft
Est. Value
About This Home
This home is located at 33818 Au Sable Dr Unit 33, Chesterfield, MI 48047 and is currently estimated at $367,275, approximately $228 per square foot. 33818 Au Sable Dr Unit 33 is a home located in Macomb County with nearby schools including Lottie M. Schmidt Elementary School, Anchor Bay Middle School South, and Anchor Bay High School.
Ownership History
Date
Name
Owned For
Owner Type
Purchase Details
Closed on
Sep 25, 2009
Sold by
Hall David M and David M Hall Revocable Living
Bought by
David M Hall Llc
Current Estimated Value
Purchase Details
Closed on
Feb 29, 2008
Sold by
Lottie M Schmidt Inc
Bought by
Hall David M and David M Hall Revocable Living
Purchase Details
Closed on
Dec 18, 2006
Sold by
Czech Buidling Inc
Bought by
Falcone Nicolo and Falcone Mary Ann
Home Financials for this Owner
Home Financials are based on the most recent Mortgage that was taken out on this home.
Original Mortgage
$130,000
Interest Rate
6.27%
Mortgage Type
Purchase Money Mortgage
Purchase Details
Closed on
Dec 15, 2006
Sold by
Lottie M Schmidt Inc
Bought by
Czech Building Inc
Home Financials for this Owner
Home Financials are based on the most recent Mortgage that was taken out on this home.
Original Mortgage
$130,000
Interest Rate
6.27%
Mortgage Type
Purchase Money Mortgage
Create a Home Valuation Report for This Property
The Home Valuation Report is an in-depth analysis detailing your home's value as well as a comparison with similar homes in the area
Home Values in the Area
Average Home Value in this Area
Purchase History
| Date | Buyer | Sale Price | Title Company |
|---|---|---|---|
| David M Hall Llc | -- | None Available | |
| Hall David M | $7,510,869 | None Available | |
| Falcone Nicolo | $229,900 | Greco | |
| Czech Building Inc | -- | Greco |
Source: Public Records
Mortgage History
| Date | Status | Borrower | Loan Amount |
|---|---|---|---|
| Previous Owner | Czech Building Inc | $130,000 |
Source: Public Records
Tax History Compared to Growth
Tax History
| Year | Tax Paid | Tax Assessment Tax Assessment Total Assessment is a certain percentage of the fair market value that is determined by local assessors to be the total taxable value of land and additions on the property. | Land | Improvement |
|---|---|---|---|---|
| 2025 | $4,078 | $158,000 | $0 | $0 |
| 2024 | $2,348 | $152,100 | $0 | $0 |
| 2023 | $2,226 | $139,100 | $0 | $0 |
| 2022 | $3,690 | $125,400 | $0 | $0 |
| 2021 | $3,588 | $118,700 | $0 | $0 |
| 2020 | $2,045 | $116,200 | $0 | $0 |
| 2019 | $3,319 | $112,000 | $0 | $0 |
| 2018 | $3,254 | $109,200 | $10,500 | $98,700 |
| 2017 | $3,187 | $104,450 | $10,500 | $93,950 |
| 2016 | $3,180 | $104,450 | $0 | $0 |
| 2015 | $1,478 | $97,550 | $0 | $0 |
| 2014 | $1,478 | $89,550 | $5,000 | $84,550 |
| 2012 | -- | $0 | $0 | $0 |
Source: Public Records
Map
Nearby Homes
- The Willow Plan at Lottivue Riverside Woods
- The Chestnut Plan at Lottivue Riverside Woods
- 33831 Au Sable Dr Unit 24
- 33796 Michigamme Dr Unit 34
- 33802 Au Sable Dr
- 33806 Au Sable New Dr Unit 38
- 33855 Au Sable Dr Unit 8
- 49596 Platte River Dr
- 49681 Manistee Dr
- 33512 Meldrum St Unit 15
- 48855 Salt River Dr
- 49016 Point Lakeview St
- 48841 Salt River Dr
- 49540 Nautical Dr
- 50293 Bellaire Dr
- 49750 Nautical Dr
- 49877 Miller Ct Unit 19
- 49400 Callens Rd
- 50249 Bellaire Dr
- 50402 Oakbrooke Dr
- 33814 Au Sable Dr
- 33814 Au Sable Dr Unit 34
- 33822 Au Sable Dr Unit 32
- 32922 Whispering Ln
- 32926 Whispering Ln Unit 51
- 32930 Whispering Ln
- 33833 Manistee Dr
- 0 Au Sable Dr
- 32938 Whispering Ln
- 32942 Whispering Ln Unit 48
- 32946 Whispering Ln
- 32950 Whispering Ln
- 33807 Au Sable Dr Unit 40
- 33811 Au Sable Dr Unit 39
- 33811 Au Sable Dr
- 33772 Michigamme Dr Unit 40
- 33776 Michigamme Dr Unit 39
- 33780 Michigamme Dr
- 33834 Au Sable Dr Unit 28
- 33830 Au Sable Dr Unit 27