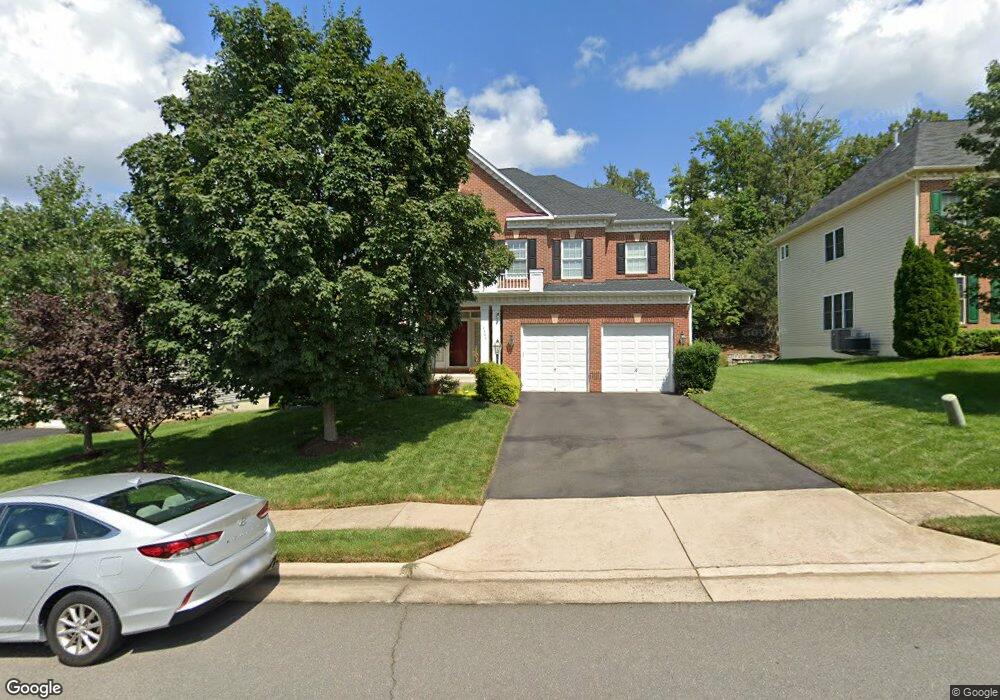
3384 Logstone Dr Triangle, VA 22172
Estimated Value: $738,473 - $801,000
4
Beds
4
Baths
3,552
Sq Ft
$217/Sq Ft
Est. Value
About This Home
This home is located at 3384 Logstone Dr, Triangle, VA 22172 and is currently estimated at $770,368, approximately $216 per square foot. 3384 Logstone Dr is a home located in Prince William County with nearby schools including Triangle Elementary School, Graham Park Middle School, and Potomac High School.
Ownership History
Date
Name
Owned For
Owner Type
Purchase Details
Closed on
Mar 25, 2009
Sold by
Central Mtg Co
Bought by
Shin Jae Un
Current Estimated Value
Home Financials for this Owner
Home Financials are based on the most recent Mortgage that was taken out on this home.
Original Mortgage
$385,000
Outstanding Balance
$237,821
Interest Rate
4.92%
Mortgage Type
VA
Estimated Equity
$532,547
Purchase Details
Closed on
Jan 26, 2009
Sold by
Johnie R Muncy Sub Tr
Bought by
Central Mtg Co
Home Financials for this Owner
Home Financials are based on the most recent Mortgage that was taken out on this home.
Original Mortgage
$385,000
Outstanding Balance
$237,821
Interest Rate
4.92%
Mortgage Type
VA
Estimated Equity
$532,547
Purchase Details
Closed on
Nov 11, 2005
Sold by
Wall Neighborhoods Llc
Bought by
Hoang Michael and Pham,Xuan Thanh
Home Financials for this Owner
Home Financials are based on the most recent Mortgage that was taken out on this home.
Original Mortgage
$527,150
Interest Rate
5.93%
Mortgage Type
New Conventional
Create a Home Valuation Report for This Property
The Home Valuation Report is an in-depth analysis detailing your home's value as well as a comparison with similar homes in the area
Home Values in the Area
Average Home Value in this Area
Purchase History
| Date | Buyer | Sale Price | Title Company |
|---|---|---|---|
| Shin Jae Un | $385,000 | -- | |
| Central Mtg Co | $385,900 | -- | |
| Hoang Michael | $658,971 | -- |
Source: Public Records
Mortgage History
| Date | Status | Borrower | Loan Amount |
|---|---|---|---|
| Open | Shin Jae Un | $385,000 | |
| Previous Owner | Hoang Michael | $527,150 |
Source: Public Records
Tax History
| Year | Tax Paid | Tax Assessment Tax Assessment Total Assessment is a certain percentage of the fair market value that is determined by local assessors to be the total taxable value of land and additions on the property. | Land | Improvement |
|---|---|---|---|---|
| 2025 | -- | $711,200 | $233,600 | $477,600 |
| 2024 | -- | $681,200 | $224,600 | $456,600 |
| 2023 | $6,529 | $627,500 | $206,100 | $421,400 |
| 2022 | $6,469 | $584,100 | $190,800 | $393,300 |
| 2021 | $6,429 | $527,700 | $171,900 | $355,800 |
| 2020 | $7,652 | $493,700 | $160,600 | $333,100 |
| 2019 | $7,598 | $490,200 | $159,100 | $331,100 |
| 2018 | $5,475 | $453,400 | $155,900 | $297,500 |
| 2017 | $5,448 | $442,400 | $151,400 | $291,000 |
| 2016 | $5,413 | $443,800 | $151,400 | $292,400 |
| 2015 | $5,254 | $428,400 | $145,600 | $282,800 |
| 2014 | $5,254 | $421,400 | $142,800 | $278,600 |
Source: Public Records
Map
Nearby Homes
- 18776 Pier Trail Dr
- 18905 Red Oak Ln
- 18747 Pier Trail Dr
- 18550 Kerill Rd
- 3671 Expedition Dr
- 19017 Barnette Cir
- 3511 Germainia Ct
- 3508 Germainia Ct
- 3203 Riverview Dr
- 3202 Riverview Dr
- 3320 Mccorkle Ct
- 3234 Riverview Dr
- 3209 Riverview Dr
- 19204 Cardinal Heights Rd
- 3170 Oakmont Ave
- 18559 Old Triangle Rd
- 3992 Shire Meadow Ln
- 4000 Post St
- 4002 Post St
- 18363 Reaper Hill Ct
- 3380 Logstone Dr
- 3388 Logstone Dr
- 3392 Logstone Dr
- 18801 Hundred Acre Ln
- 4000 Sapling Way
- 3396 Logstone Dr
- 3301 Dondis Creek Dr
- 3372 Logstone Dr
- 18805 Hundred Acre Ln
- 3395 Logstone Dr
- 4004 Sapling Way
- 3300 Dondis Creek Dr
- 3400 Logstone Dr
- 3305 Dondis Creek Dr
- 4001 Sapling Way
- 3368 Logstone Dr
- 18806 Hundred Acre Ln
- 18809 Hundred Acre Ln
- 4008 Sapling Way
- 3399 Logstone Dr
Your Personal Tour Guide
Ask me questions while you tour the home.