Estimated Value: $614,000 - $702,000
5
Beds
4
Baths
4,100
Sq Ft
$163/Sq Ft
Est. Value
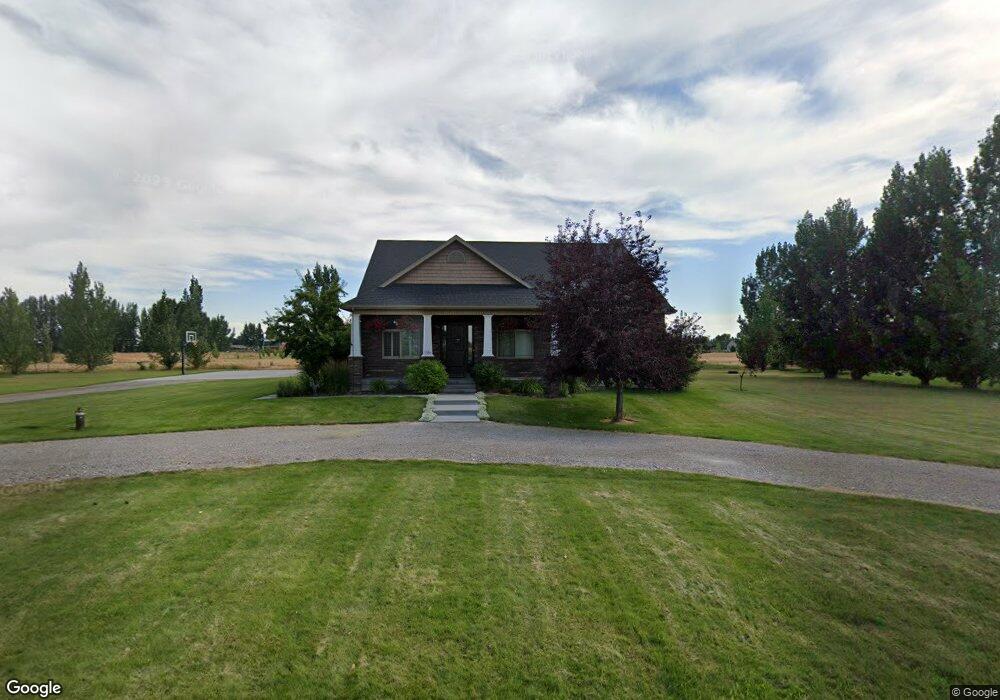
About This Home
This home is located at 3386 E 200 N, Rigby, ID 83442 and is currently estimated at $668,726, approximately $163 per square foot. 3386 E 200 N is a home located in Jefferson County with nearby schools including Midway Elementary School, Rigby Middle School, and Rigby High School.
Ownership History
Date
Name
Owned For
Owner Type
Purchase Details
Closed on
Feb 1, 2018
Sold by
Barney Wells Ray and Barney Mary Louise
Bought by
Barney Nicholas Richard and Barney Kimberly Jean
Current Estimated Value
Home Financials for this Owner
Home Financials are based on the most recent Mortgage that was taken out on this home.
Original Mortgage
$325,753
Outstanding Balance
$234,037
Interest Rate
3.99%
Mortgage Type
Seller Take Back
Estimated Equity
$434,689
Purchase Details
Closed on
Apr 13, 2011
Sold by
Zions First National Bank
Bought by
Barney Nicholas R and Bailey Richard
Home Financials for this Owner
Home Financials are based on the most recent Mortgage that was taken out on this home.
Original Mortgage
$129,500
Interest Rate
4.83%
Mortgage Type
New Conventional
Purchase Details
Closed on
Feb 21, 2007
Sold by
Hancock Dean and Hancock Barbara
Bought by
Madsen Rhett and Madsen Tenille
Create a Home Valuation Report for This Property
The Home Valuation Report is an in-depth analysis detailing your home's value as well as a comparison with similar homes in the area
Purchase History
| Date | Buyer | Sale Price | Title Company |
|---|---|---|---|
| Barney Nicholas Richard | -- | First American Title Rigby | |
| Barney Nicholas R | -- | -- | |
| Madsen Rhett | -- | None Available |
Source: Public Records
Mortgage History
| Date | Status | Borrower | Loan Amount |
|---|---|---|---|
| Open | Barney Nicholas Richard | $325,753 | |
| Closed | Barney Nicholas R | $129,500 |
Source: Public Records
Tax History
| Year | Tax Paid | Tax Assessment Tax Assessment Total Assessment is a certain percentage of the fair market value that is determined by local assessors to be the total taxable value of land and additions on the property. | Land | Improvement |
|---|---|---|---|---|
| 2025 | $1,427 | $611,259 | $0 | $0 |
| 2024 | $1,427 | $583,867 | $0 | $0 |
| 2023 | $2,075 | $602,612 | $0 | $0 |
| 2022 | $2,892 | $520,741 | $0 | $0 |
| 2021 | $2,751 | $408,688 | $0 | $0 |
| 2020 | $2,235 | $375,869 | $0 | $0 |
| 2019 | $2,211 | $308,789 | $0 | $0 |
| 2018 | $1,933 | $271,451 | $0 | $0 |
| 2017 | $1,698 | $244,190 | $0 | $0 |
| 2016 | $1,702 | $141,867 | $0 | $0 |
| 2015 | $1,750 | $140,506 | $0 | $0 |
| 2014 | $1,678 | $134,479 | $0 | $0 |
| 2013 | -- | $117,090 | $0 | $0 |
Source: Public Records
Map
Nearby Homes
Your Personal Tour Guide
Ask me questions while you tour the home.