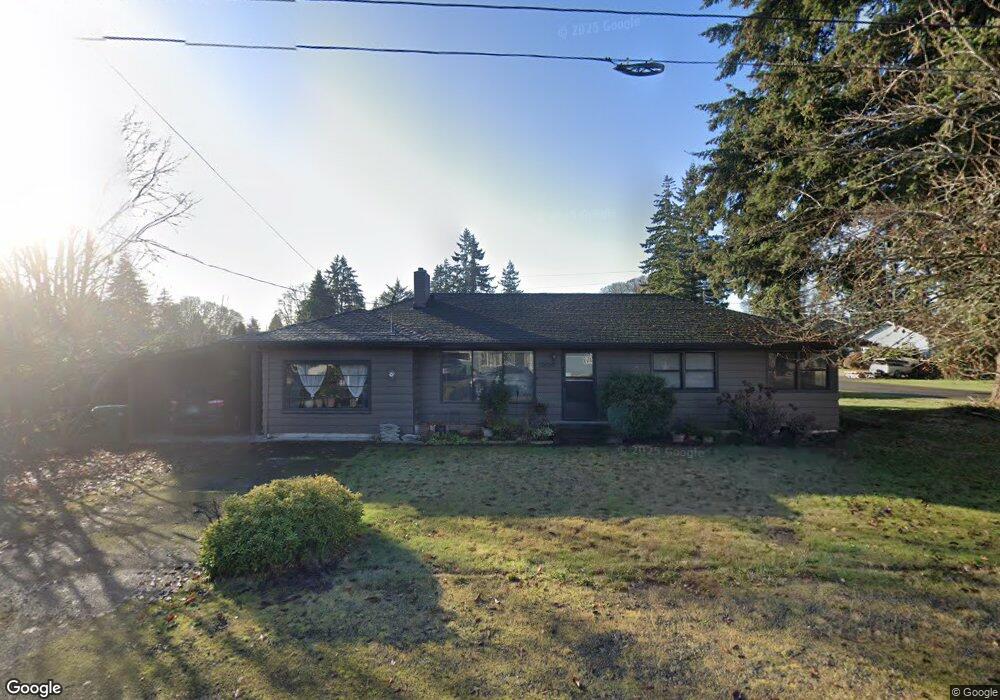
33868 NE Prairie St Scappoose, OR 97056
Estimated Value: $370,000 - $430,000
3
Beds
1
Bath
1,472
Sq Ft
$271/Sq Ft
Est. Value
About This Home
This home is located at 33868 NE Prairie St, Scappoose, OR 97056 and is currently estimated at $399,218, approximately $271 per square foot. 33868 NE Prairie St is a home located in Columbia County with nearby schools including Scappoose High School, South Columbia Family School, and Scappoose Adventist School.
Ownership History
Date
Name
Owned For
Owner Type
Purchase Details
Closed on
Apr 11, 2019
Sold by
Semling Rita V
Bought by
Semling Rita V and Semling Living Trust
Current Estimated Value
Purchase Details
Closed on
Feb 20, 2013
Sold by
Hafeman Residential Properties Ii Llc
Bought by
Semling Rita V
Home Financials for this Owner
Home Financials are based on the most recent Mortgage that was taken out on this home.
Original Mortgage
$92,250
Outstanding Balance
$64,052
Interest Rate
3.34%
Mortgage Type
New Conventional
Estimated Equity
$335,166
Purchase Details
Closed on
Feb 15, 2013
Sold by
Semling Rita V
Bought by
Semling Rita V
Home Financials for this Owner
Home Financials are based on the most recent Mortgage that was taken out on this home.
Original Mortgage
$92,250
Outstanding Balance
$64,052
Interest Rate
3.34%
Mortgage Type
New Conventional
Estimated Equity
$335,166
Create a Home Valuation Report for This Property
The Home Valuation Report is an in-depth analysis detailing your home's value as well as a comparison with similar homes in the area
Home Values in the Area
Average Home Value in this Area
Purchase History
| Date | Buyer | Sale Price | Title Company |
|---|---|---|---|
| Semling Rita V | -- | None Available | |
| Semling Rita V | -- | Ticor Title | |
| Semling Rita V | -- | Ticor Title |
Source: Public Records
Mortgage History
| Date | Status | Borrower | Loan Amount |
|---|---|---|---|
| Open | Semling Rita V | $92,250 |
Source: Public Records
Tax History Compared to Growth
Tax History
| Year | Tax Paid | Tax Assessment Tax Assessment Total Assessment is a certain percentage of the fair market value that is determined by local assessors to be the total taxable value of land and additions on the property. | Land | Improvement |
|---|---|---|---|---|
| 2025 | $3,100 | $188,260 | $77,140 | $111,120 |
| 2024 | $3,014 | $182,780 | $74,890 | $107,890 |
| 2023 | $2,986 | $177,460 | $80,060 | $97,400 |
| 2022 | $2,860 | $172,300 | $77,740 | $94,560 |
| 2021 | $2,778 | $167,290 | $81,390 | $85,900 |
| 2020 | $2,577 | $162,420 | $77,470 | $84,950 |
| 2019 | $2,509 | $157,690 | $74,610 | $83,080 |
| 2018 | $2,452 | $153,100 | $86,560 | $66,540 |
| 2017 | $2,408 | $148,650 | $84,040 | $64,610 |
| 2016 | $2,378 | $144,330 | $81,590 | $62,740 |
| 2015 | $2,234 | $140,130 | $79,570 | $60,560 |
| 2014 | $2,182 | $136,050 | $72,210 | $63,840 |
Source: Public Records
Map
Nearby Homes
- 51587 SE Oak St
- 51425 SE Oak St Unit 65
- 52256 SE 6th Ct
- 52171 Casswell Dr
- 52866 NE 2nd St
- 52269 SE Tyler St
- 52144 SE 8th St
- 33399 NW Ej Smith Rd
- 52238 Teakwood Dr
- 33374 Wickstrom Dr
- 52407 NE 14th St
- 51925 Columbia River Hwy
- 33375 SW Rokin Way
- 33363 SW Rokin Way
- 33358 SW Rokin Way
- 33370 SW Rokin Way
- 33344 SW Rokin Way
- 53194 Columbia River Hwy
- 51784 SE 9th St
- 51692 SE 3rd St
- 52528 NE 5th St
- 33878 NE Prairie St
- 52518 NE 5th St
- 33838 NE Prairie St
- 33867 NE Prairie St
- 33877 NE Prairie St
- 33857 NE Prairie St
- 33877 E Columbia Ave
- 52521 NE 5th St
- 33898 NE Prairie St
- 52500 NE 5th St
- 33875 E Columbia Ave
- 33837 NE Prairie St
- 33897 NE Prairie St
- 33824 NE Prairie St
- 33815 E Columbia Ave
- 33862 NE Kale St
- 33870 NE Kale St
- 33873 E Columbia Ave
- 33854 NE Kale St