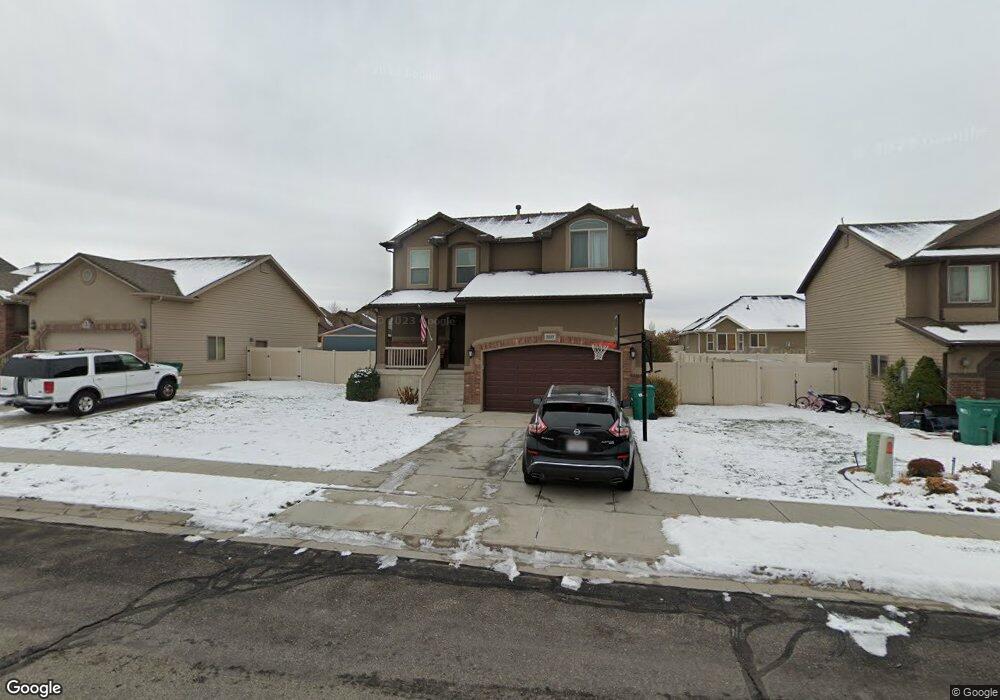
3387 W 4375 S West Haven, UT 84401
Estimated Value: $490,000 - $528,000
3
Beds
3
Baths
2,156
Sq Ft
$234/Sq Ft
Est. Value
About This Home
This home is located at 3387 W 4375 S, West Haven, UT 84401 and is currently estimated at $504,549, approximately $234 per square foot. 3387 W 4375 S is a home located in Weber County with nearby schools including West Haven School, Sand Ridge Junior High School, and Roy High School.
Ownership History
Date
Name
Owned For
Owner Type
Purchase Details
Closed on
May 7, 2009
Sold by
Castle Creek Homes Llc
Bought by
Campbell James R and Campbell Ashley W
Current Estimated Value
Home Financials for this Owner
Home Financials are based on the most recent Mortgage that was taken out on this home.
Original Mortgage
$191,344
Outstanding Balance
$120,570
Interest Rate
4.8%
Mortgage Type
FHA
Estimated Equity
$383,979
Purchase Details
Closed on
Jan 23, 2009
Sold by
Mike Schultz Construction Inc
Bought by
Campbell James R and Campbell Ashley W
Purchase Details
Closed on
Nov 14, 2005
Sold by
Northern Developers Llc
Bought by
Mike Schultz Construction Inc
Home Financials for this Owner
Home Financials are based on the most recent Mortgage that was taken out on this home.
Original Mortgage
$1,100,000
Interest Rate
5.93%
Mortgage Type
Construction
Create a Home Valuation Report for This Property
The Home Valuation Report is an in-depth analysis detailing your home's value as well as a comparison with similar homes in the area
Home Values in the Area
Average Home Value in this Area
Purchase History
| Date | Buyer | Sale Price | Title Company |
|---|---|---|---|
| Campbell James R | -- | Mountain View Title Ogden | |
| Campbell James R | -- | Mountain View Title Ogden | |
| Campbell James R | -- | Mountain View Title Ogden | |
| Mike Schultz Construction Inc | -- | Heritage West Title Insuranc |
Source: Public Records
Mortgage History
| Date | Status | Borrower | Loan Amount |
|---|---|---|---|
| Open | Campbell James R | $191,344 | |
| Previous Owner | Mike Schultz Construction Inc | $1,100,000 | |
| Closed | Campbell James R | $0 |
Source: Public Records
Tax History Compared to Growth
Tax History
| Year | Tax Paid | Tax Assessment Tax Assessment Total Assessment is a certain percentage of the fair market value that is determined by local assessors to be the total taxable value of land and additions on the property. | Land | Improvement |
|---|---|---|---|---|
| 2025 | $2,916 | $473,255 | $134,805 | $338,450 |
| 2024 | $2,817 | $255,749 | $74,142 | $181,607 |
| 2023 | $3,020 | $274,450 | $74,108 | $200,342 |
| 2022 | $2,853 | $266,200 | $71,361 | $194,839 |
| 2021 | $2,417 | $379,000 | $79,098 | $299,902 |
| 2020 | $2,320 | $335,000 | $64,035 | $270,965 |
| 2019 | $2,086 | $282,000 | $58,273 | $223,727 |
| 2018 | $1,988 | $256,000 | $53,082 | $202,918 |
| 2017 | $1,825 | $226,000 | $51,978 | $174,022 |
| 2016 | $1,633 | $108,008 | $25,634 | $82,374 |
| 2015 | $1,559 | $101,222 | $22,771 | $78,451 |
| 2014 | $1,458 | $91,588 | $22,771 | $68,817 |
Source: Public Records
Map
Nearby Homes
- 4317 S 3350 W
- 4491 Haven Creek Rd Unit A
- 4440 Stone Creek Rd Unit 2E
- 3434 W 4525 S
- 4510 Stone Creek Rd Unit F
- 3084 W 4375 S
- Villages Townhome Plan at Green Farm - Villages
- 4124 S 3560 W
- 3652 W 4625 S
- 3554 W 4100 S Unit 63
- 3632 W 4650 S
- 2979 W 4275 S
- 3627 W 4650 S
- 3669 W 4625 S
- 3692 W 4625 S
- 4351 W 4000 S
- 3171 W 4725 S
- 3385 W 3950 S
- 3960 S 3375 W
- 3671 W 4700 S
- 3401 W 4375 S
- 3378 W 4450 S
- 4432 S 3375 W
- 3411 W 4375 S
- 3411 W 4375 S Unit 4
- 3365 W 4375 S
- 3392 W 4375 S
- 3380 W 4375 S
- 3392 W 4450 S
- 3404 W 4375 S
- 3370 W 4375 S
- 4433 Haven Creek Rd Unit C
- 4433 Haven Creek Rd Unit B
- 4433 Haven Creek Rd
- 4433 Haven Creek Rd Unit A
- 4433 Haven Creek Rd Unit 8B
- 4433 Haven Creek Rd Unit 8A
- 3423 W 4375 S
- 3353 W 4375 S
- 4454 S 3375 W