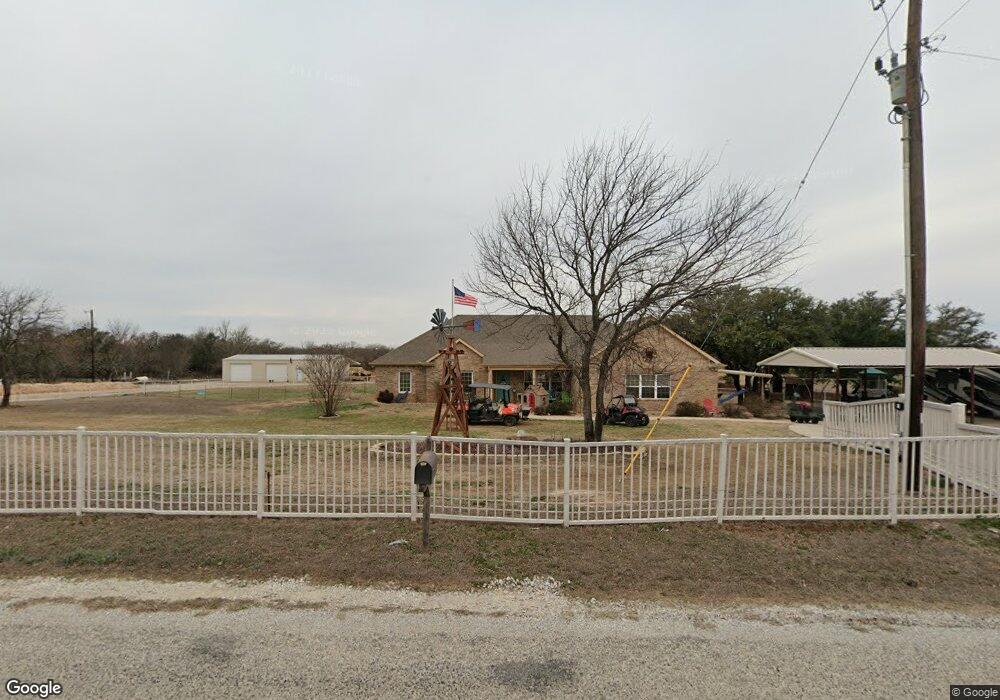
3388 Adell Cir Weatherford, TX 76088
Estimated Value: $892,000
--
Bed
--
Bath
2,475
Sq Ft
$360/Sq Ft
Est. Value
About This Home
This home is located at 3388 Adell Cir, Weatherford, TX 76088 and is currently estimated at $892,000, approximately $360 per square foot. 3388 Adell Cir is a home located in Parker County with nearby schools including Peaster Elementary School, Peaster Middle School, and Peaster High School.
Ownership History
Date
Name
Owned For
Owner Type
Purchase Details
Closed on
Feb 28, 2017
Sold by
Wolf Brett R
Bought by
Wolf Brett R and Wolf Jennifer E
Current Estimated Value
Home Financials for this Owner
Home Financials are based on the most recent Mortgage that was taken out on this home.
Original Mortgage
$344,000
Outstanding Balance
$284,627
Interest Rate
4.09%
Mortgage Type
Credit Line Revolving
Estimated Equity
$607,373
Purchase Details
Closed on
Jun 29, 2010
Sold by
Homes For Our Troops Inc
Bought by
Wolf Brett R
Home Financials for this Owner
Home Financials are based on the most recent Mortgage that was taken out on this home.
Original Mortgage
$340,000
Interest Rate
4.77%
Mortgage Type
Seller Take Back
Purchase Details
Closed on
May 4, 2009
Sold by
Hamblin Douglas N and Hamblin Lisa A
Bought by
Wolf Brett R and Wolf Jennifer E
Create a Home Valuation Report for This Property
The Home Valuation Report is an in-depth analysis detailing your home's value as well as a comparison with similar homes in the area
Home Values in the Area
Average Home Value in this Area
Purchase History
| Date | Buyer | Sale Price | Title Company |
|---|---|---|---|
| Wolf Brett R | -- | Fidelity National Title | |
| Wolf Brett R | -- | Fatco | |
| Wolf Brett R | -- | -- | |
| Homes For Our Troops Inc | -- | Stnt |
Source: Public Records
Mortgage History
| Date | Status | Borrower | Loan Amount |
|---|---|---|---|
| Open | Wolf Brett R | $344,000 | |
| Closed | Wolf Brett R | $340,000 |
Source: Public Records
Tax History Compared to Growth
Tax History
| Year | Tax Paid | Tax Assessment Tax Assessment Total Assessment is a certain percentage of the fair market value that is determined by local assessors to be the total taxable value of land and additions on the property. | Land | Improvement |
|---|---|---|---|---|
| 2025 | -- | $1,166,410 | $620,100 | $546,310 |
| 2024 | -- | $935,450 | $467,250 | $468,200 |
| 2023 | $12,026 | $685,370 | $0 | $0 |
| 2022 | $12,427 | $623,070 | $259,200 | $363,870 |
| 2021 | $12,498 | $623,070 | $259,200 | $363,870 |
| 2020 | $10,614 | $517,530 | $170,280 | $347,250 |
| 2019 | $11,152 | $517,530 | $170,280 | $347,250 |
| 2018 | $10,469 | $484,400 | $167,400 | $317,000 |
| 2017 | $10,418 | $484,410 | $167,400 | $317,010 |
| 2016 | $7,367 | $342,570 | $121,740 | $220,830 |
| 2015 | $0 | $342,570 | $121,740 | $220,830 |
| 2014 | -- | $323,640 | $121,740 | $201,900 |
Source: Public Records
Map
Nearby Homes
- 412 Adell Cir
- 750 Adell Cir
- 7211 N Fm 113
- 108 Stafford Trail
- 2025 Liberty Ct
- 1012 Freedom Ct
- 1029 Freedom Ct
- 6915 Fm 1885
- TBD Nikki Trill Ln
- TBD Ballard Rd
- Lot 3 Advance
- 223 Reata Ranch Dr
- 227 Reata Ranch Dr
- 555 Advance Rd
- 6500 Fm Rd Unit 1885
- 431 Advance Rd
- 2710 Advance Rd
- 136 Aslan Rd
- 132 Aslan Rd
- Lot 2 Advance Rd
- 3300 Adell Cir
- 8412 Fm 1885
- 000 Adell Cir
- 8802 Fm 1885
- 8808 Fm 1885
- 3601 Adell Cir
- 9040 Fm 1885
- 2501 Adell Cir
- 8990 Fm 1885
- 7940 Farm To Market Road 1885
- 400 Cottontail Ln
- 8901 Fm 1885
- 8407 Fm 1885
- 7920 Fm 1885
- 550 Rawhide Trail
- 550 Rawhide Trail
- 7802 Fm 1885
- 301 Cottontail Ln
- 9061 Fm 1885
- 2100 Adell Cir