Estimated Value: $217,000 - $279,000
4
Beds
--
Bath
2,088
Sq Ft
$117/Sq Ft
Est. Value
About This Home
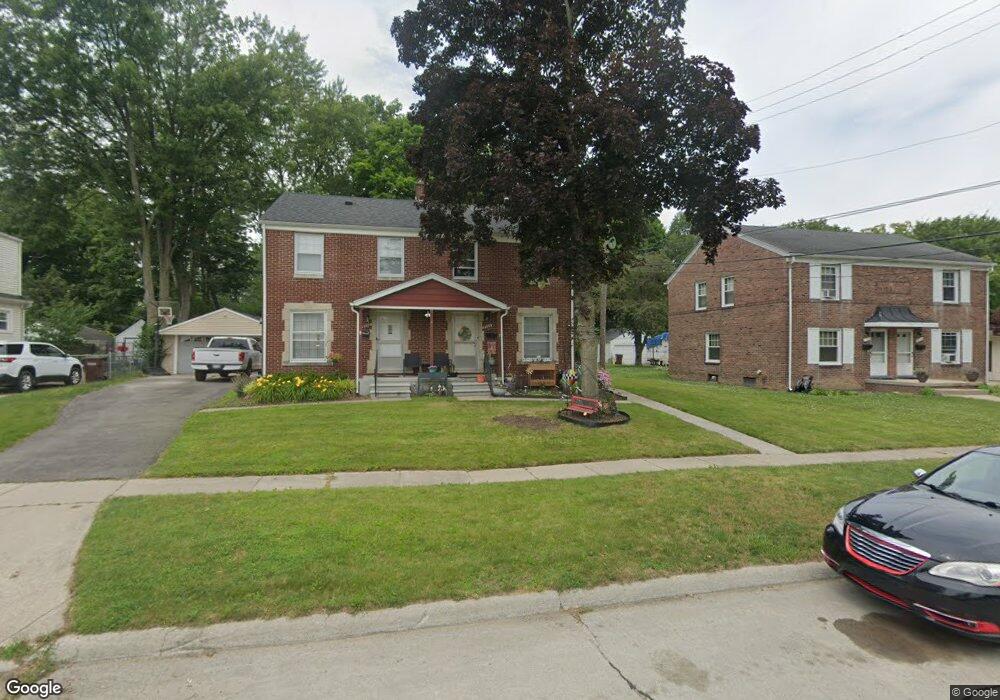
This home is located at 3388 Clark St, Wayne, MI 48184 and is currently estimated at $243,844, approximately $116 per square foot. 3388 Clark St is a home located in Wayne County with nearby schools including Roosevelt/Mcgrath Elementary School, Wayne Memorial High School, and Adlai Stevenson Middle School.
Ownership History
Date
Name
Owned For
Owner Type
Purchase Details
Closed on
Jun 2, 2010
Sold by
Duty Lara L
Bought by
Federal Home Loan Mortgage Corp
Current Estimated Value
Purchase Details
Closed on
Mar 17, 2008
Sold by
Edwards Miriam H
Bought by
Duty Lara L
Purchase Details
Closed on
Nov 9, 1994
Sold by
Est Marguerite Ardinger
Bought by
Miriam Edwards
Home Financials for this Owner
Home Financials are based on the most recent Mortgage that was taken out on this home.
Original Mortgage
$85,000
Interest Rate
9.23%
Mortgage Type
New Conventional
Create a Home Valuation Report for This Property
The Home Valuation Report is an in-depth analysis detailing your home's value as well as a comparison with similar homes in the area
Home Values in the Area
Average Home Value in this Area
Purchase History
| Date | Buyer | Sale Price | Title Company |
|---|---|---|---|
| Federal Home Loan Mortgage Corp | $41,000 | None Available | |
| Duty Lara L | $150,000 | First American Title Ins Co | |
| Miriam Edwards | $89,500 | -- |
Source: Public Records
Mortgage History
| Date | Status | Borrower | Loan Amount |
|---|---|---|---|
| Previous Owner | Miriam Edwards | $85,000 |
Source: Public Records
Tax History
| Year | Tax Paid | Tax Assessment Tax Assessment Total Assessment is a certain percentage of the fair market value that is determined by local assessors to be the total taxable value of land and additions on the property. | Land | Improvement |
|---|---|---|---|---|
| 2025 | $4,729 | $120,100 | $0 | $0 |
| 2024 | $4,586 | $112,100 | $0 | $0 |
| 2023 | $4,375 | $116,300 | $0 | $0 |
| 2022 | $4,828 | $100,000 | $0 | $0 |
| 2021 | $4,710 | $92,400 | $0 | $0 |
| 2020 | $5,625 | $82,200 | $0 | $0 |
| 2019 | $3,965 | $76,600 | $0 | $0 |
| 2018 | $3,759 | $69,700 | $0 | $0 |
| 2017 | $1,098 | $67,700 | $0 | $0 |
| 2016 | $4,413 | $70,600 | $0 | $0 |
| 2015 | $6,736 | $69,700 | $0 | $0 |
| 2013 | $6,530 | $66,800 | $0 | $0 |
| 2012 | -- | $68,300 | $10,900 | $57,400 |
Source: Public Records
Map
Nearby Homes
- 35732 W Michigan Ave
- 35724 Elm St
- 3450 Pershing St
- 35757 E Michigan Ave
- 35801 Glenwood Rd
- 35726 Brush St Unit 3
- 35730 Brush St Unit 1
- 35324 Chestnut St
- 35457 Brush St
- 35324/ 326 Chestnut St
- 0000 E Michigan Ave
- 36686 Thinbark St
- 35833 Farragut Ave
- 34915 Chestnut St
- 34934 Brush St
- 4306 Elizabeth St
- 36891 Thinbark St
- 35373 Forest St Unit 15
- 36884 Greenbush Rd
- 36231 Schley Ave
- 3350 Clark St
- 3424 Clark St
- 3340 Clark St
- 3432 Clark St
- 3326 Clark St
- 3442 Clark St
- 3375 Clark St
- 3343 Clark St
- 3415 Williams St
- 3335 Clark St
- 3347 Williams St
- 3312 Clark St
- 3419 Williams St
- 3369 Williams St
- 3325 Clark St
- 3325 Williams St
- 35640 W Michigan Ave
- 35712 W Michigan Ave
- 3315 Clark St
- 35622 W Michigan Ave
Your Personal Tour Guide
Ask me questions while you tour the home.