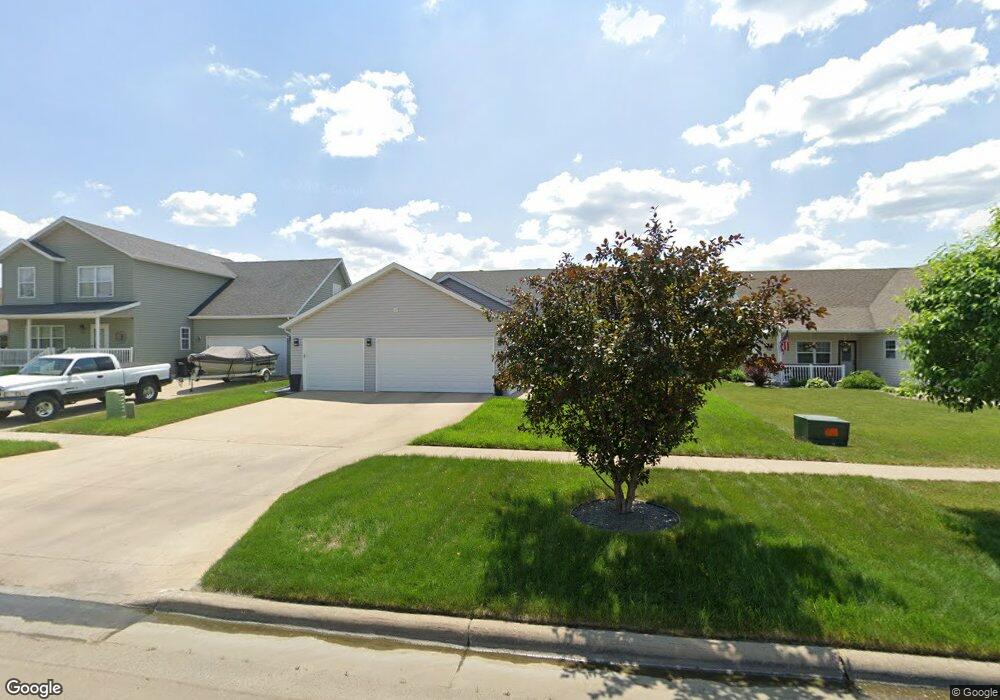
339 19th Ave W West Fargo, ND 58078
Elmwood Court NeighborhoodEstimated Value: $374,171 - $377,000
4
Beds
2
Baths
2,080
Sq Ft
$181/Sq Ft
Est. Value
About This Home
This home is located at 339 19th Ave W, West Fargo, ND 58078 and is currently estimated at $375,586, approximately $180 per square foot. 339 19th Ave W is a home located in Cass County with nearby schools including Westside Elementary School, Cheney Middle School, and West Fargo High School.
Ownership History
Date
Name
Owned For
Owner Type
Purchase Details
Closed on
Jul 26, 2019
Sold by
Hs Investments Llc
Bought by
Nelson Nicole R and Weltin Drew R
Current Estimated Value
Home Financials for this Owner
Home Financials are based on the most recent Mortgage that was taken out on this home.
Original Mortgage
$243,955
Outstanding Balance
$214,184
Interest Rate
3.82%
Mortgage Type
New Conventional
Estimated Equity
$161,402
Purchase Details
Closed on
Jan 25, 2019
Sold by
The Bank Of New York Mellon
Bought by
Hs Investments Llc
Purchase Details
Closed on
Nov 21, 2018
Sold by
Golliet Chayla M and Golliet Kirk P
Bought by
Teh Bank Of New York Mellon and Teh Bank Of New York
Purchase Details
Closed on
Oct 25, 2006
Sold by
Weichert Reloccation Resources Inc
Bought by
Golliet Kirk P and Golliet Chayla M
Home Financials for this Owner
Home Financials are based on the most recent Mortgage that was taken out on this home.
Original Mortgage
$150,100
Interest Rate
10.15%
Mortgage Type
Adjustable Rate Mortgage/ARM
Purchase Details
Closed on
Jul 6, 2006
Sold by
Carmona Ronald and Carmona Connie
Bought by
Weichert Relocation Resources Inc
Create a Home Valuation Report for This Property
The Home Valuation Report is an in-depth analysis detailing your home's value as well as a comparison with similar homes in the area
Home Values in the Area
Average Home Value in this Area
Purchase History
| Date | Buyer | Sale Price | Title Company |
|---|---|---|---|
| Nelson Nicole R | $251,500 | Title Co | |
| Hs Investments Llc | $139,125 | Title Co | |
| Teh Bank Of New York Mellon | $180,000 | None Available | |
| Golliet Kirk P | -- | -- | |
| Weichert Relocation Resources Inc | -- | -- |
Source: Public Records
Mortgage History
| Date | Status | Borrower | Loan Amount |
|---|---|---|---|
| Open | Nelson Nicole R | $243,955 | |
| Previous Owner | Golliet Kirk P | $150,100 |
Source: Public Records
Tax History Compared to Growth
Tax History
| Year | Tax Paid | Tax Assessment Tax Assessment Total Assessment is a certain percentage of the fair market value that is determined by local assessors to be the total taxable value of land and additions on the property. | Land | Improvement |
|---|---|---|---|---|
| 2024 | $3,948 | $155,700 | $23,650 | $132,050 |
| 2023 | $4,356 | $152,250 | $23,650 | $128,600 |
| 2022 | $4,278 | $143,350 | $23,650 | $119,700 |
| 2021 | $4,077 | $131,850 | $18,900 | $112,950 |
| 2020 | $3,787 | $126,500 | $18,900 | $107,600 |
| 2019 | $3,332 | $114,750 | $18,900 | $95,850 |
| 2018 | $3,892 | $115,800 | $18,900 | $96,900 |
| 2017 | $4,685 | $114,850 | $18,900 | $95,950 |
| 2016 | $4,400 | $112,550 | $18,900 | $93,650 |
| 2015 | $4,548 | $97,950 | $13,000 | $84,950 |
| 2014 | $4,274 | $91,550 | $13,000 | $78,550 |
| 2013 | $4,197 | $89,250 | $13,000 | $76,250 |
Source: Public Records
Map
Nearby Homes
- 405 19th Ave W
- 333 19th Ave W
- 411 19th Ave W
- 327 19th Ave W
- 411 411 19th-Avenue-w
- 417 19th Ave W
- 321 19th Ave W
- 423 19th Ave W
- 429 19th Ave W
- 309 19th Ave W
- 435 19th Ave W
- 412 19th Ave W Unit A
- 412 19th Ave W Unit C
- 412 19th Ave W Unit B
- 412 19th Ave W Unit F
- 412 19th Ave W Unit E
- 412 19th Ave W
- 412 19th Ave W Unit F
- 412 19th Ave W Unit D
- 412 19th Ave W Unit B