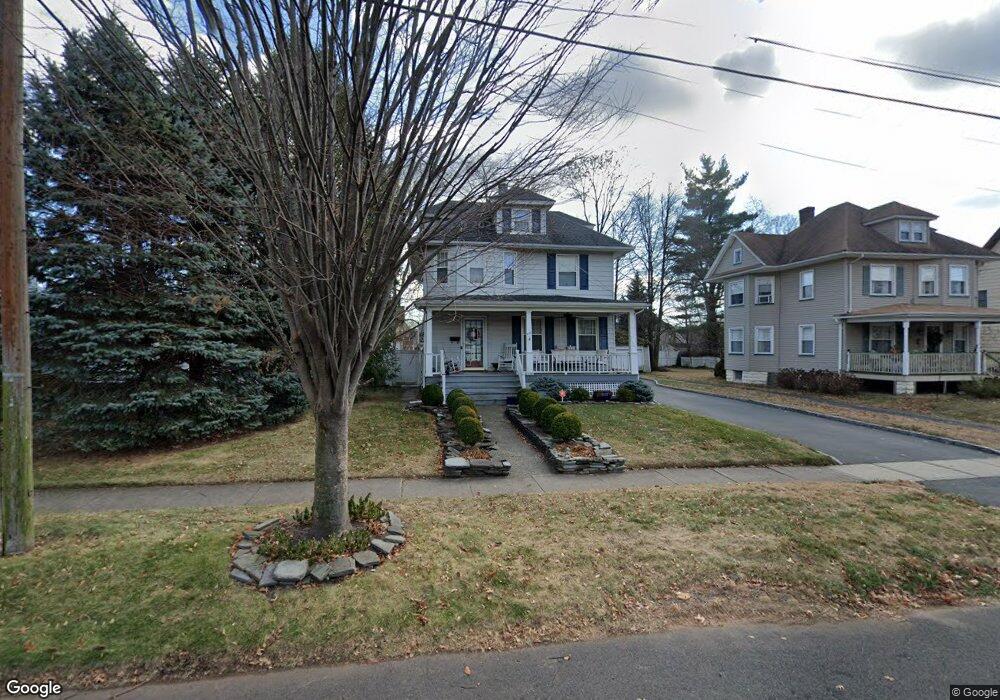
339 3rd St Dunellen, NJ 08812
Estimated Value: $518,000 - $668,000
Studio
--
Bath
2,044
Sq Ft
$292/Sq Ft
Est. Value
About This Home
This home is located at 339 3rd St, Dunellen, NJ 08812 and is currently estimated at $597,554, approximately $292 per square foot. 339 3rd St is a home located in Middlesex County with nearby schools including John P. Faber Elementary School, Lincoln Middle School, and Dunellen High School.
Ownership History
Date
Name
Owned For
Owner Type
Purchase Details
Closed on
Nov 20, 2012
Sold by
Barca Ivan and Barca Kimberly
Bought by
Barca Ivan and Barca Kimberly
Current Estimated Value
Home Financials for this Owner
Home Financials are based on the most recent Mortgage that was taken out on this home.
Original Mortgage
$226,100
Interest Rate
3.46%
Mortgage Type
New Conventional
Purchase Details
Closed on
Mar 16, 2004
Sold by
Payesko Robert
Bought by
Barca Ivan and Wiercinski Kiimberly
Home Financials for this Owner
Home Financials are based on the most recent Mortgage that was taken out on this home.
Original Mortgage
$284,080
Interest Rate
5.4%
Purchase Details
Closed on
Mar 8, 2002
Sold by
Winn Joann
Bought by
Payesko Robert and Payesko Donna
Home Financials for this Owner
Home Financials are based on the most recent Mortgage that was taken out on this home.
Original Mortgage
$156,000
Interest Rate
7.18%
Create a Home Valuation Report for This Property
The Home Valuation Report is an in-depth analysis detailing your home's value as well as a comparison with similar homes in the area
Home Values in the Area
Average Home Value in this Area
Purchase History
| Date | Buyer | Sale Price | Title Company |
|---|---|---|---|
| Barca Ivan | -- | None Available | |
| Barca Ivan | $355,100 | -- | |
| Payesko Robert | $195,000 | -- |
Source: Public Records
Mortgage History
| Date | Status | Borrower | Loan Amount |
|---|---|---|---|
| Closed | Barca Ivan | $226,100 | |
| Closed | Barca Ivan | $284,080 | |
| Previous Owner | Payesko Robert | $156,000 |
Source: Public Records
Tax History
| Year | Tax Paid | Tax Assessment Tax Assessment Total Assessment is a certain percentage of the fair market value that is determined by local assessors to be the total taxable value of land and additions on the property. | Land | Improvement |
|---|---|---|---|---|
| 2025 | $13,626 | $550,700 | $118,500 | $432,200 |
| 2024 | $12,638 | $543,300 | $118,500 | $424,800 |
Source: Public Records
Map
Nearby Homes
Your Personal Tour Guide
Ask me questions while you tour the home.