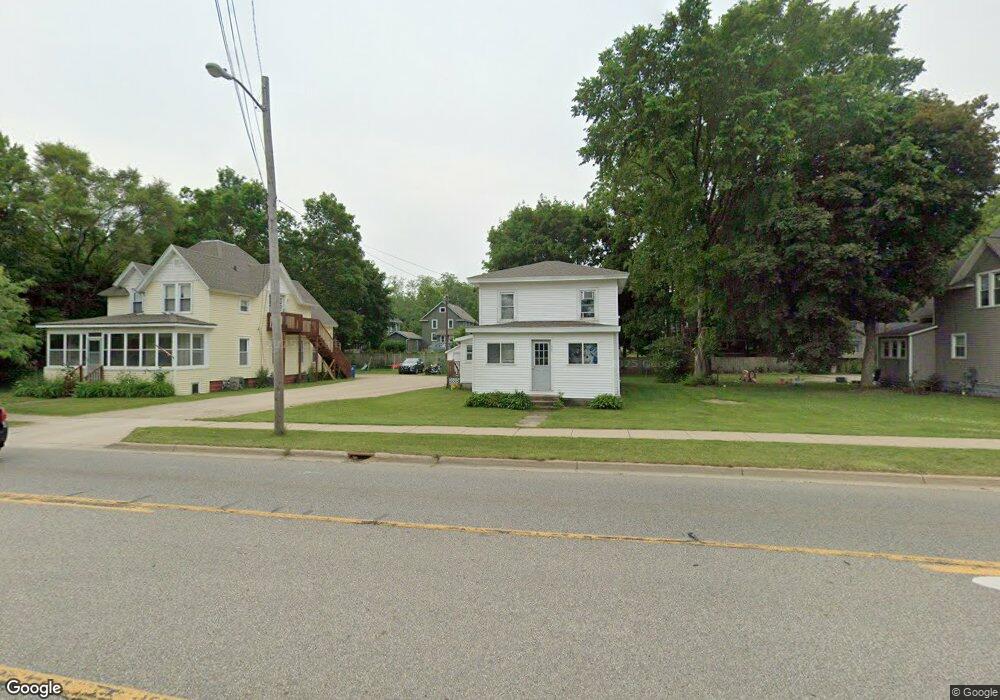
339 Allegan St Plainwell, MI 49080
Estimated Value: $157,000 - $201,418
3
Beds
1
Bath
1,268
Sq Ft
$147/Sq Ft
Est. Value
About This Home
This home is located at 339 Allegan St, Plainwell, MI 49080 and is currently estimated at $186,605, approximately $147 per square foot. 339 Allegan St is a home located in Allegan County with nearby schools including Plainwell High School and Otsego Christian Academy.
Ownership History
Date
Name
Owned For
Owner Type
Purchase Details
Closed on
Dec 8, 2004
Sold by
Fifth Third Bank
Bought by
Harvey Debra A
Current Estimated Value
Home Financials for this Owner
Home Financials are based on the most recent Mortgage that was taken out on this home.
Original Mortgage
$49,600
Outstanding Balance
$26,102
Interest Rate
6.5%
Mortgage Type
Purchase Money Mortgage
Estimated Equity
$160,503
Purchase Details
Closed on
Sep 19, 2002
Sold by
Retherford Jaymie L
Bought by
Old Kent Mortgage Co
Purchase Details
Closed on
Nov 22, 2000
Sold by
Nogle Tamara A
Bought by
Retherford Jaymie L
Create a Home Valuation Report for This Property
The Home Valuation Report is an in-depth analysis detailing your home's value as well as a comparison with similar homes in the area
Home Values in the Area
Average Home Value in this Area
Purchase History
| Date | Buyer | Sale Price | Title Company |
|---|---|---|---|
| Harvey Debra A | $62,000 | Metropolitan Title Company | |
| Old Kent Mortgage Co | $76,500 | -- | |
| Retherford Jaymie L | $84,600 | -- |
Source: Public Records
Mortgage History
| Date | Status | Borrower | Loan Amount |
|---|---|---|---|
| Open | Harvey Debra A | $49,600 | |
| Closed | Harvey Debra A | $6,200 |
Source: Public Records
Tax History Compared to Growth
Tax History
| Year | Tax Paid | Tax Assessment Tax Assessment Total Assessment is a certain percentage of the fair market value that is determined by local assessors to be the total taxable value of land and additions on the property. | Land | Improvement |
|---|---|---|---|---|
| 2025 | $2,436 | $73,500 | $12,000 | $61,500 |
| 2024 | $2,198 | $68,700 | $12,000 | $56,700 |
| 2023 | $2,197 | $61,400 | $12,000 | $49,400 |
| 2022 | $2,198 | $56,800 | $12,000 | $44,800 |
| 2021 | $2,117 | $54,500 | $12,000 | $42,500 |
| 2020 | $2,089 | $51,400 | $12,000 | $39,400 |
| 2019 | $1,940 | $50,500 | $12,000 | $38,500 |
| 2018 | $0 | $49,800 | $14,700 | $35,100 |
| 2017 | $0 | $45,900 | $11,400 | $34,500 |
| 2016 | $0 | $36,000 | $6,700 | $29,300 |
| 2015 | -- | $36,000 | $6,700 | $29,300 |
| 2014 | -- | $28,900 | $3,600 | $25,300 |
| 2013 | -- | $29,900 | $3,600 | $26,300 |
Source: Public Records
Map
Nearby Homes
- 426 W Bridge St
- 551 W Bridge St
- 140 W 1st Ave
- 771 N Main St
- 623 Glenview Cir
- 317 E Chart St
- 204 N Sherwood Ave
- 355 12th St
- 455 N 10th St
- 390 12th St
- 1056 Elmwood St
- 721 E Bridge St
- 518 Foxmoor Dr Unit 39
- V/L 11th St
- 1036 Sir Knight Rd
- 965 Miller Rd
- 1081 Sir Knight Rd
- 1183 Miller Rd
- 830 Miller Rd Unit 9.86 Acres
- 830 Miller Rd Unit 26.94 Acres