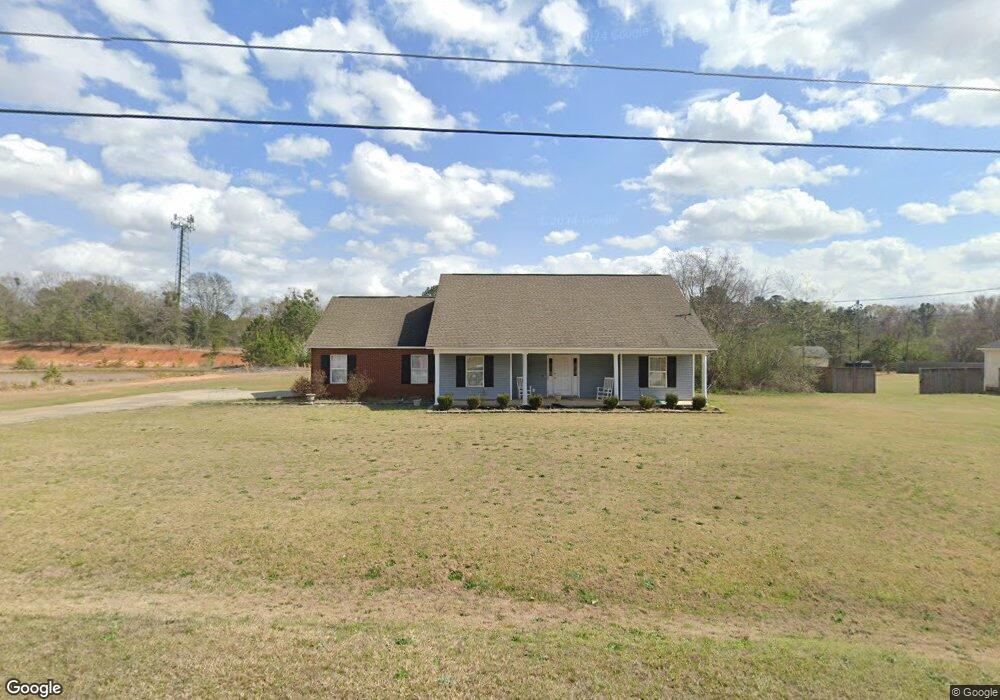
339 Amanda Dr Macon, GA 31216
Estimated Value: $269,000 - $280,000
3
Beds
2
Baths
1,880
Sq Ft
$146/Sq Ft
Est. Value
About This Home
This home is located at 339 Amanda Dr, Macon, GA 31216 and is currently estimated at $274,105, approximately $145 per square foot. 339 Amanda Dr is a home located in Bibb County with nearby schools including Heard Elementary School, Rutland Middle School, and Rutland High School.
Ownership History
Date
Name
Owned For
Owner Type
Purchase Details
Closed on
Mar 7, 2023
Sold by
Graham Cynthia
Bought by
Graham Cynthia and Graham Kinterria
Current Estimated Value
Purchase Details
Closed on
Feb 24, 2012
Sold by
Graham Kirk J
Bought by
Graham Cynthia L
Purchase Details
Closed on
Mar 3, 2006
Sold by
Referral Homes Inc
Bought by
Graham Cynthia and Graham Kirk
Home Financials for this Owner
Home Financials are based on the most recent Mortgage that was taken out on this home.
Original Mortgage
$111,200
Interest Rate
7.44%
Mortgage Type
Adjustable Rate Mortgage/ARM
Purchase Details
Closed on
Aug 11, 2005
Create a Home Valuation Report for This Property
The Home Valuation Report is an in-depth analysis detailing your home's value as well as a comparison with similar homes in the area
Purchase History
| Date | Buyer | Sale Price | Title Company |
|---|---|---|---|
| Graham Cynthia | -- | -- | |
| Graham Cynthia L | -- | None Available | |
| Graham Cynthia | $139,000 | None Avilabale | |
| -- | $22,900 | -- | |
| Three Oaks Construction And Development | -- | None Available | |
| Referral Homes Inc | $22,900 | None Avilabale |
Source: Public Records
Mortgage History
| Date | Status | Borrower | Loan Amount |
|---|---|---|---|
| Previous Owner | Graham Cynthia | $111,200 |
Source: Public Records
Tax History
| Year | Tax Paid | Tax Assessment Tax Assessment Total Assessment is a certain percentage of the fair market value that is determined by local assessors to be the total taxable value of land and additions on the property. | Land | Improvement |
|---|---|---|---|---|
| 2025 | $2,583 | $112,097 | $12,760 | $99,337 |
| 2024 | $2,540 | $107,022 | $12,760 | $94,262 |
| 2023 | $2,305 | $84,829 | $12,320 | $72,509 |
| 2022 | $2,679 | $84,379 | $9,200 | $75,179 |
| 2021 | $2,525 | $73,456 | $9,200 | $64,256 |
| 2020 | $1,839 | $65,190 | $7,360 | $57,830 |
| 2019 | $2,106 | $60,811 | $7,360 | $53,451 |
| 2018 | $3,406 | $60,811 | $7,360 | $53,451 |
| 2017 | $1,780 | $54,522 | $7,360 | $47,162 |
| 2016 | $1,644 | $54,522 | $7,360 | $47,162 |
| 2015 | $2,328 | $54,522 | $7,360 | $47,162 |
| 2014 | $2,331 | $54,522 | $7,360 | $47,162 |
Source: Public Records
Map
Nearby Homes
- 297 Amanda Dr
- 350 Browning Pointe Rd
- 344 Browning Pointe Rd
- 268 Amanda Dr
- 2800 S Estates Rd
- 261 Amanda Dr
- 116 Fred Ct
- 2813 S Estates Rd
- 224 Liberty Trace
- 201 Liberty Trace
- 6045 Cara Dr
- 6168 Edwards Dr
- 2154 Allen Rd
- 4057 Liberty Estates Dr
- 3038 Debra Ann Dr
- 3150 Holleman Dr
- 6414 Ponderosa Dr
- 308 Ellis Ct
- 3285 Hartley Bridge Rd
- 7070 Sofkee Place
Your Personal Tour Guide
Ask me questions while you tour the home.