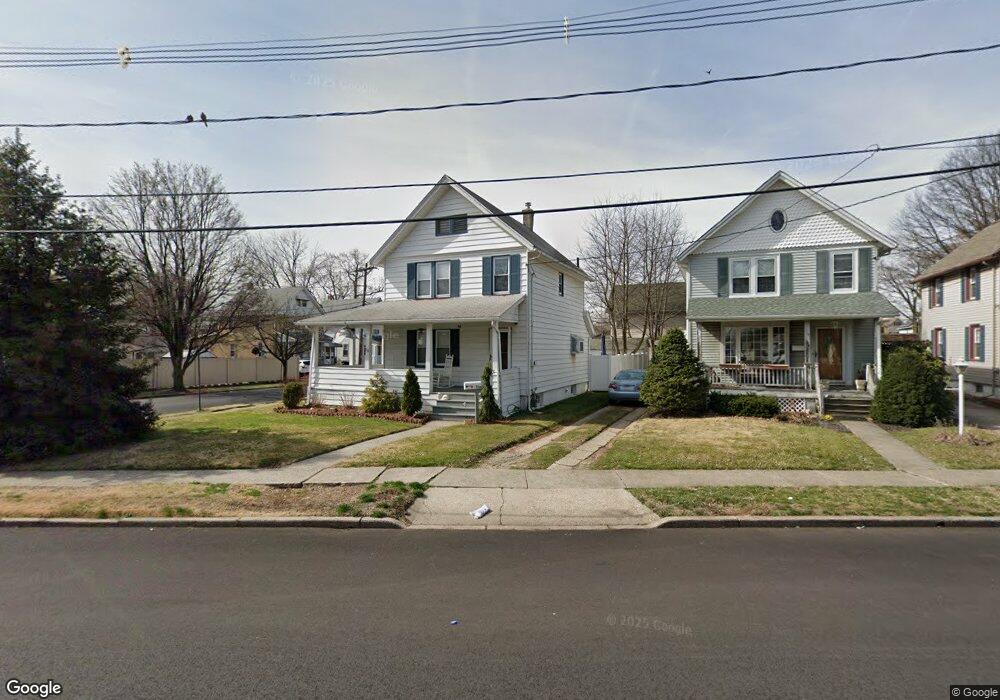
339 Berry St Woodbridge, NJ 07095
Estimated Value: $316,209 - $476,000
3
Beds
2
Baths
1,088
Sq Ft
$381/Sq Ft
Est. Value
About This Home
This home is located at 339 Berry St, Woodbridge, NJ 07095 and is currently estimated at $414,552, approximately $381 per square foot. 339 Berry St is a home located in Middlesex County with nearby schools including Ross Street Elementary School, Woodbridge Middle School, and Woodbridge High School.
Ownership History
Date
Name
Owned For
Owner Type
Purchase Details
Closed on
Aug 7, 2013
Sold by
Mateo Rosa A and Arias Rosa
Bought by
Mateo Rosa A
Current Estimated Value
Home Financials for this Owner
Home Financials are based on the most recent Mortgage that was taken out on this home.
Original Mortgage
$247,350
Outstanding Balance
$183,578
Interest Rate
4.34%
Mortgage Type
New Conventional
Estimated Equity
$230,974
Purchase Details
Closed on
Aug 26, 2005
Sold by
Bufaino Brigida
Bought by
Mateo Rosa and Arias Luis
Home Financials for this Owner
Home Financials are based on the most recent Mortgage that was taken out on this home.
Original Mortgage
$244,000
Interest Rate
5.84%
Mortgage Type
New Conventional
Purchase Details
Closed on
Oct 12, 1999
Sold by
Grimm Earl
Bought by
Bufaino Brigida
Home Financials for this Owner
Home Financials are based on the most recent Mortgage that was taken out on this home.
Original Mortgage
$114,000
Interest Rate
7.73%
Create a Home Valuation Report for This Property
The Home Valuation Report is an in-depth analysis detailing your home's value as well as a comparison with similar homes in the area
Home Values in the Area
Average Home Value in this Area
Purchase History
| Date | Buyer | Sale Price | Title Company |
|---|---|---|---|
| Mateo Rosa A | -- | None Available | |
| Mateo Rosa | $305,000 | -- | |
| Bufaino Brigida | $120,000 | -- |
Source: Public Records
Mortgage History
| Date | Status | Borrower | Loan Amount |
|---|---|---|---|
| Open | Mateo Rosa A | $247,350 | |
| Closed | Mateo Rosa | $244,000 | |
| Previous Owner | Bufaino Brigida | $114,000 |
Source: Public Records
Tax History Compared to Growth
Tax History
| Year | Tax Paid | Tax Assessment Tax Assessment Total Assessment is a certain percentage of the fair market value that is determined by local assessors to be the total taxable value of land and additions on the property. | Land | Improvement |
|---|---|---|---|---|
| 2025 | $7,783 | $57,500 | $16,600 | $40,900 |
| 2024 | $7,590 | $57,500 | $16,600 | $40,900 |
| 2023 | $7,590 | $57,500 | $16,600 | $40,900 |
| 2022 | $7,128 | $57,500 | $16,600 | $40,900 |
| 2021 | $7,054 | $57,500 | $16,600 | $40,900 |
| 2020 | $6,822 | $57,500 | $16,600 | $40,900 |
| 2019 | $6,649 | $57,500 | $16,600 | $40,900 |
| 2018 | $6,474 | $57,500 | $16,600 | $40,900 |
| 2017 | $6,343 | $57,500 | $16,600 | $40,900 |
| 2016 | $6,283 | $57,500 | $16,600 | $40,900 |
| 2015 | $6,159 | $57,500 | $16,600 | $40,900 |
| 2014 | $6,013 | $57,500 | $16,600 | $40,900 |
Source: Public Records
Map
Nearby Homes