Estimated Value: $117,000 - $125,000
2
Beds
1
Bath
932
Sq Ft
$130/Sq Ft
Est. Value
About This Home
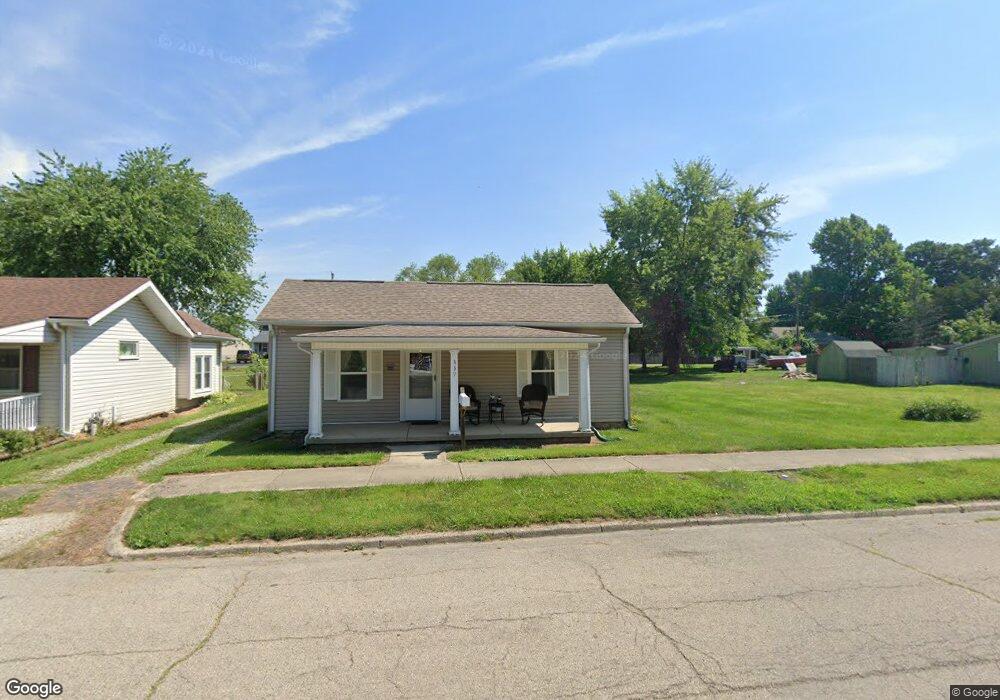
This home is located at 339 Center St, Xenia, OH 45385 and is currently estimated at $121,106, approximately $129 per square foot. 339 Center St is a home located in Greene County with nearby schools including Xenia High School, Summit Academy Community School for Alternative Learners - Xenia, and Legacy Christian Academy.
Ownership History
Date
Name
Owned For
Owner Type
Purchase Details
Closed on
Nov 13, 2020
Sold by
Charles William T and Jordan Carmen I
Bought by
Brown Glenda E
Current Estimated Value
Home Financials for this Owner
Home Financials are based on the most recent Mortgage that was taken out on this home.
Original Mortgage
$78,452
Outstanding Balance
$69,811
Interest Rate
2.8%
Mortgage Type
FHA
Estimated Equity
$51,295
Purchase Details
Closed on
Aug 21, 2019
Sold by
Charles William T
Bought by
Charles William T and Jordan Carman I
Purchase Details
Closed on
Mar 25, 2011
Sold by
Hilderbrandt Harley L and Hilderbrandt Wanda B
Bought by
Charles William T
Home Financials for this Owner
Home Financials are based on the most recent Mortgage that was taken out on this home.
Original Mortgage
$32,900
Interest Rate
4.99%
Mortgage Type
New Conventional
Purchase Details
Closed on
Feb 1, 2002
Sold by
Morris Herbert W
Bought by
Hilderbrandt Harley L and Hilderbrandt Wanda B
Create a Home Valuation Report for This Property
The Home Valuation Report is an in-depth analysis detailing your home's value as well as a comparison with similar homes in the area
Home Values in the Area
Average Home Value in this Area
Purchase History
| Date | Buyer | Sale Price | Title Company |
|---|---|---|---|
| Brown Glenda E | $79,900 | None Available | |
| Charles William T | -- | None Available | |
| Charles William T | $34,000 | Attorney | |
| Hilderbrandt Harley L | $9,700 | -- |
Source: Public Records
Mortgage History
| Date | Status | Borrower | Loan Amount |
|---|---|---|---|
| Open | Brown Glenda E | $78,452 | |
| Previous Owner | Charles William T | $32,900 |
Source: Public Records
Tax History Compared to Growth
Tax History
| Year | Tax Paid | Tax Assessment Tax Assessment Total Assessment is a certain percentage of the fair market value that is determined by local assessors to be the total taxable value of land and additions on the property. | Land | Improvement |
|---|---|---|---|---|
| 2024 | $633 | $24,990 | $5,740 | $19,250 |
| 2023 | $633 | $24,990 | $5,740 | $19,250 |
| 2022 | $497 | $18,920 | $4,600 | $14,320 |
| 2021 | $504 | $18,920 | $4,600 | $14,320 |
| 2020 | $922 | $18,920 | $4,600 | $14,320 |
| 2019 | $851 | $16,450 | $5,460 | $10,990 |
| 2018 | $855 | $16,450 | $5,460 | $10,990 |
| 2017 | $825 | $16,450 | $5,460 | $10,990 |
| 2016 | $826 | $15,600 | $5,460 | $10,140 |
| 2015 | $828 | $15,600 | $5,460 | $10,140 |
| 2014 | $793 | $15,600 | $5,460 | $10,140 |
Source: Public Records
Map
Nearby Homes
- 331 Center St
- 365 Center St
- 321 Center St
- 311 Center St
- 274 Charles St
- 296 Charles St
- 264 Charles St
- 295 Center St
- 320 Center St
- 418 Cincinnati Ave
- 424 Cincinnati Ave
- 338 Center St
- 434 Cincinnati Ave
- 410 Cincinnati Ave
- 350 Center St
- 330 Center St
- 372 Center St
- 360 Center St
- 285 Center St
- 252 Charles St