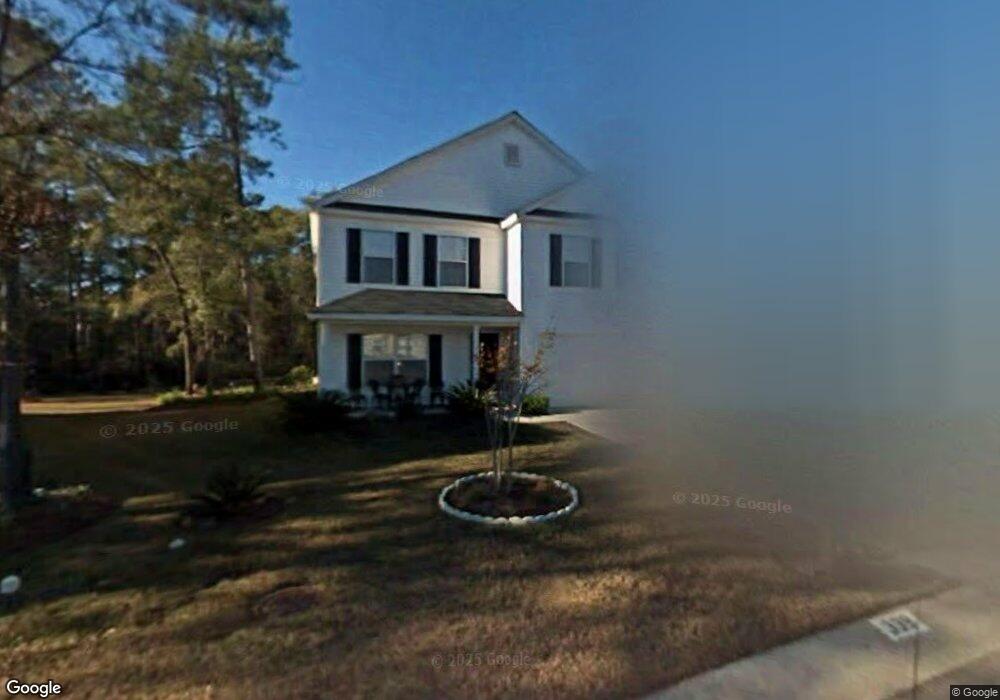
339 Cohen Cir Ladson, SC 29456
Estimated Value: $347,000 - $391,000
4
Beds
3
Baths
2,514
Sq Ft
$149/Sq Ft
Est. Value
About This Home
This home is located at 339 Cohen Cir, Ladson, SC 29456 and is currently estimated at $373,970, approximately $148 per square foot. 339 Cohen Cir is a home located in Berkeley County with nearby schools including Sangaree Elementary School, Sangaree Intermediate School, and Sangaree Middle School.
Ownership History
Date
Name
Owned For
Owner Type
Purchase Details
Closed on
Apr 10, 2019
Sold by
Grow Christopher James and Grow Jesica Lynn
Bought by
Torrence Travis and Torrence Michelle R
Current Estimated Value
Home Financials for this Owner
Home Financials are based on the most recent Mortgage that was taken out on this home.
Original Mortgage
$225,834
Outstanding Balance
$202,178
Interest Rate
5.25%
Mortgage Type
FHA
Estimated Equity
$171,792
Purchase Details
Closed on
Dec 18, 2013
Sold by
Rollins Boris D and Rollins Lucy M
Bought by
Grow Christopher James and Grow Jesica Lynn
Home Financials for this Owner
Home Financials are based on the most recent Mortgage that was taken out on this home.
Original Mortgage
$201,746
Interest Rate
4.25%
Mortgage Type
VA
Purchase Details
Closed on
Nov 14, 2003
Sold by
Beazer Homes Corp
Bought by
Rollins Boris D and Rollins Lucy M
Purchase Details
Closed on
Jun 3, 2003
Sold by
Ward Johnny and Gaskins Cohen
Bought by
Beazer Homes Corp
Create a Home Valuation Report for This Property
The Home Valuation Report is an in-depth analysis detailing your home's value as well as a comparison with similar homes in the area
Home Values in the Area
Average Home Value in this Area
Purchase History
| Date | Buyer | Sale Price | Title Company |
|---|---|---|---|
| Torrence Travis | $230,000 | None Available | |
| Grow Christopher James | $197,500 | -- | |
| Rollins Boris D | $154,065 | -- | |
| Beazer Homes Corp | $300,000 | -- |
Source: Public Records
Mortgage History
| Date | Status | Borrower | Loan Amount |
|---|---|---|---|
| Open | Torrence Travis | $225,834 | |
| Previous Owner | Grow Christopher James | $201,746 |
Source: Public Records
Tax History
| Year | Tax Paid | Tax Assessment Tax Assessment Total Assessment is a certain percentage of the fair market value that is determined by local assessors to be the total taxable value of land and additions on the property. | Land | Improvement |
|---|---|---|---|---|
| 2025 | $1,312 | $271,055 | $30,685 | $240,370 |
| 2024 | $1,261 | $10,842 | $1,227 | $9,615 |
| 2023 | $1,261 | $10,842 | $1,227 | $9,615 |
| 2022 | $1,258 | $9,428 | $1,280 | $8,148 |
| 2021 | $1,288 | $9,430 | $1,280 | $8,148 |
| 2020 | $1,303 | $9,428 | $1,280 | $8,148 |
| 2019 | $1,159 | $10,988 | $1,280 | $9,708 |
| 2018 | $3,255 | $10,578 | $1,920 | $8,658 |
| 2017 | $3,106 | $10,578 | $1,920 | $8,658 |
| 2016 | $3,135 | $10,580 | $1,920 | $8,660 |
| 2015 | $875 | $7,050 | $1,280 | $5,770 |
| 2014 | $1,722 | $7,050 | $1,280 | $5,770 |
| 2013 | -- | $7,050 | $1,280 | $5,770 |
Source: Public Records
Map
Nearby Homes
- 310 Cohen Cir
- 1009 Friartuck Trail
- 2010 Cripplecreek Dr
- 142 Fern Ct
- 105 Traders Station Rd
- 106 Fern Ct
- 1065 Friartuck Trail
- 109 Wisteria Ct
- 3033 Kinswood Ln
- 2003 Wishing Well Trail
- 115 Broken Trail
- 1070 Briar Rose Ln
- 482 Courtland Dr
- 110 Frankie Ln
- 1401 Dahoo Ln
- 0 Treeland Dr Unit 25010333
- 2014 Hunters Bend Trail
- 106 Hialeah Ct
- 803 Eastern White Pines Rd
- 101 Hialeah Ct
Your Personal Tour Guide
Ask me questions while you tour the home.