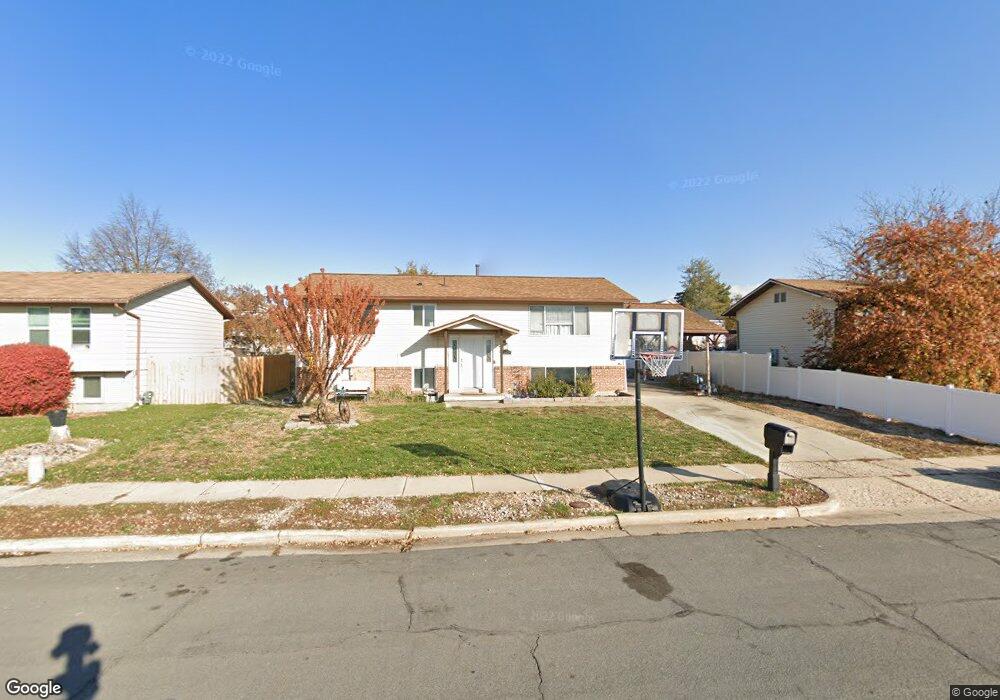
339 E 1250 N Layton, UT 84041
Estimated Value: $419,839 - $451,000
4
Beds
2
Baths
1,029
Sq Ft
$419/Sq Ft
Est. Value
About This Home
This home is located at 339 E 1250 N, Layton, UT 84041 and is currently estimated at $431,460, approximately $419 per square foot. 339 E 1250 N is a home located in Davis County with nearby schools including King Elementary School, Central Davis Junior High School, and Northridge High School.
Ownership History
Date
Name
Owned For
Owner Type
Purchase Details
Closed on
Sep 25, 2019
Sold by
Jones Brittany L
Bought by
Britanny Jones Trust
Current Estimated Value
Purchase Details
Closed on
Aug 15, 2019
Sold by
Jones Blake J
Bought by
Jones Brittany L
Purchase Details
Closed on
Feb 13, 2009
Sold by
Bachus Toni L
Bought by
Jones Blake J
Home Financials for this Owner
Home Financials are based on the most recent Mortgage that was taken out on this home.
Original Mortgage
$88,995
Outstanding Balance
$55,740
Interest Rate
5.01%
Mortgage Type
FHA
Estimated Equity
$375,720
Create a Home Valuation Report for This Property
The Home Valuation Report is an in-depth analysis detailing your home's value as well as a comparison with similar homes in the area
Home Values in the Area
Average Home Value in this Area
Purchase History
| Date | Buyer | Sale Price | Title Company |
|---|---|---|---|
| Britanny Jones Trust | -- | None Available | |
| Jones Brittany L | -- | None Available | |
| Jones Blake J | -- | Backman Title Services |
Source: Public Records
Mortgage History
| Date | Status | Borrower | Loan Amount |
|---|---|---|---|
| Open | Jones Blake J | $88,995 |
Source: Public Records
Tax History
| Year | Tax Paid | Tax Assessment Tax Assessment Total Assessment is a certain percentage of the fair market value that is determined by local assessors to be the total taxable value of land and additions on the property. | Land | Improvement |
|---|---|---|---|---|
| 2025 | $1,975 | $207,350 | $99,118 | $108,232 |
| 2024 | $1,919 | $202,950 | $115,664 | $87,286 |
| 2023 | $1,889 | $352,000 | $139,109 | $212,891 |
| 2022 | $1,896 | $191,950 | $73,071 | $118,879 |
| 2021 | $1,782 | $269,000 | $101,243 | $167,757 |
| 2020 | $1,609 | $233,000 | $85,715 | $147,285 |
| 2019 | $1,593 | $226,000 | $81,892 | $144,108 |
| 2018 | $1,440 | $205,000 | $81,892 | $123,108 |
| 2016 | $1,242 | $91,245 | $25,821 | $65,424 |
| 2015 | $1,149 | $80,135 | $25,821 | $54,314 |
| 2014 | $1,126 | $80,295 | $25,821 | $54,474 |
| 2013 | -- | $78,101 | $18,612 | $59,489 |
Source: Public Records
Map
Nearby Homes
Your Personal Tour Guide
Ask me questions while you tour the home.