Estimated Value: $378,000 - $387,000
4
Beds
2
Baths
1,025
Sq Ft
$373/Sq Ft
Est. Value
About This Home
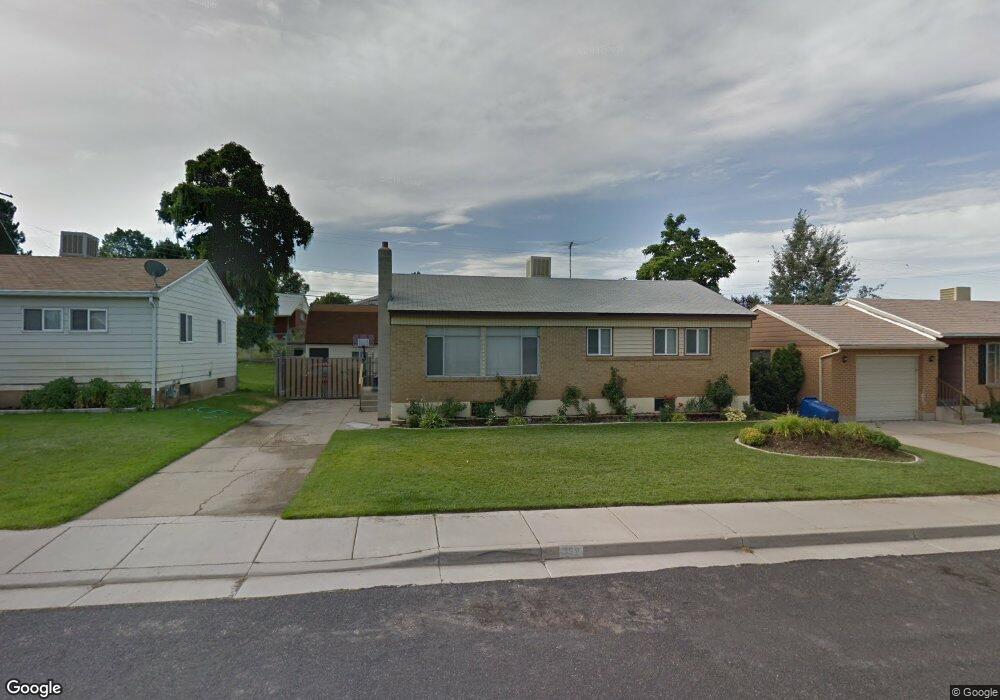
This home is located at 339 E 4775 S, Ogden, UT 84405 and is currently estimated at $382,182, approximately $372 per square foot. 339 E 4775 S is a home located in Weber County with nearby schools including Washington Terrace School, T.H. Bell Junior High School, and Bonneville High School.
Ownership History
Date
Name
Owned For
Owner Type
Purchase Details
Closed on
Oct 25, 2007
Sold by
Thyfault Dennis M and Thyfault Kathryn L
Bought by
Croft Troy S
Current Estimated Value
Home Financials for this Owner
Home Financials are based on the most recent Mortgage that was taken out on this home.
Original Mortgage
$4,770
Outstanding Balance
$3,001
Interest Rate
6.27%
Mortgage Type
Stand Alone Second
Estimated Equity
$379,181
Purchase Details
Closed on
Aug 14, 2003
Sold by
Thyfault Dennis M and Thyfault Kathryn L
Bought by
Thyfault Dennis M and Thyfault Kathryn L
Home Financials for this Owner
Home Financials are based on the most recent Mortgage that was taken out on this home.
Original Mortgage
$76,650
Interest Rate
5.29%
Mortgage Type
Purchase Money Mortgage
Create a Home Valuation Report for This Property
The Home Valuation Report is an in-depth analysis detailing your home's value as well as a comparison with similar homes in the area
Home Values in the Area
Average Home Value in this Area
Purchase History
| Date | Buyer | Sale Price | Title Company |
|---|---|---|---|
| Croft Troy S | -- | Mountain View Title Ogden | |
| Thyfault Dennis M | -- | Meridian Title |
Source: Public Records
Mortgage History
| Date | Status | Borrower | Loan Amount |
|---|---|---|---|
| Open | Croft Troy S | $4,770 | |
| Open | Croft Troy S | $147,584 | |
| Previous Owner | Thyfault Dennis M | $76,650 |
Source: Public Records
Tax History
| Year | Tax Paid | Tax Assessment Tax Assessment Total Assessment is a certain percentage of the fair market value that is determined by local assessors to be the total taxable value of land and additions on the property. | Land | Improvement |
|---|---|---|---|---|
| 2025 | $2,519 | $372,689 | $107,501 | $265,188 |
| 2024 | $2,385 | $198,548 | $59,125 | $139,423 |
| 2023 | $2,309 | $191,950 | $59,557 | $132,393 |
| 2022 | $2,453 | $212,850 | $56,893 | $155,957 |
| 2021 | $1,852 | $257,000 | $53,731 | $203,269 |
| 2020 | $1,838 | $234,000 | $44,011 | $189,989 |
| 2019 | $1,748 | $205,000 | $44,011 | $160,989 |
| 2018 | $1,524 | $173,000 | $44,011 | $128,989 |
| 2017 | $1,415 | $149,000 | $29,020 | $119,980 |
| 2016 | $1,265 | $71,681 | $16,232 | $55,449 |
| 2015 | $1,284 | $71,681 | $16,232 | $55,449 |
| 2014 | $1,217 | $66,839 | $16,232 | $50,607 |
Source: Public Records
Map
Nearby Homes
Your Personal Tour Guide
Ask me questions while you tour the home.