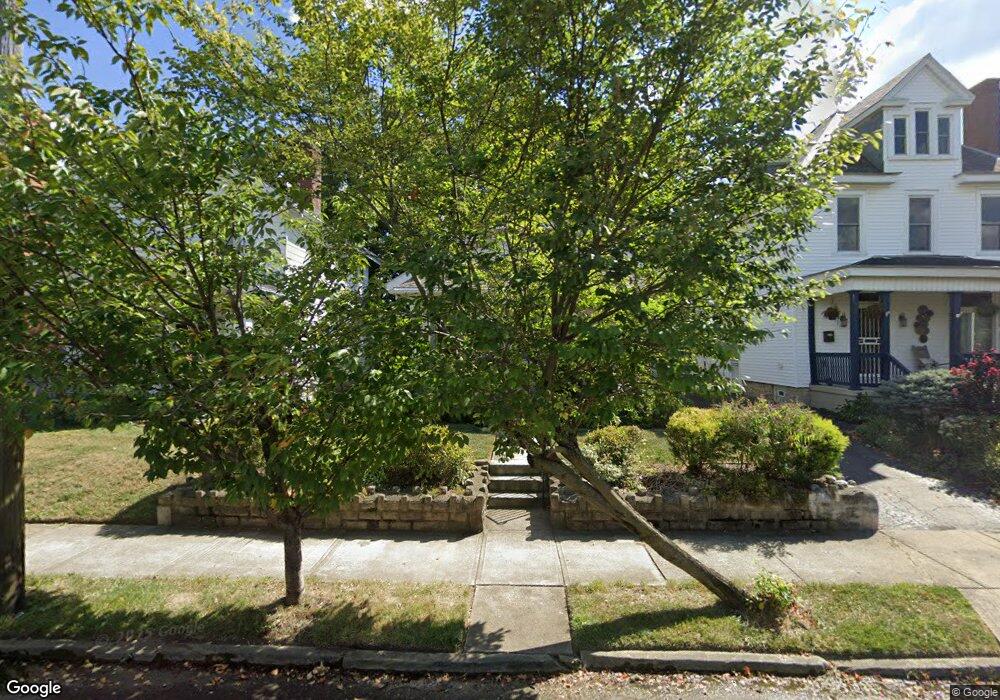
339 E Jenkins Ave Columbus, OH 43207
Merion Village NeighborhoodEstimated Value: $306,000 - $381,000
3
Beds
1
Bath
1,032
Sq Ft
$336/Sq Ft
Est. Value
About This Home
This home is located at 339 E Jenkins Ave, Columbus, OH 43207 and is currently estimated at $347,170, approximately $336 per square foot. 339 E Jenkins Ave is a home located in Franklin County with nearby schools including Southwood Elementary School, South High School, and South Columbus Preparatory Academy.
Ownership History
Date
Name
Owned For
Owner Type
Purchase Details
Closed on
Feb 3, 2026
Sold by
Ziebel Anna C
Bought by
Ziebel Anna C and Ziebel Adam W
Current Estimated Value
Purchase Details
Closed on
Oct 15, 2012
Sold by
Bradehoff Stephen N
Bought by
Ziebel Anna C and Brandehoff Anna C
Purchase Details
Closed on
Apr 23, 2001
Sold by
Renzi Anthony
Bought by
Brandehoff Stephen N and Brandehoff Anna C
Home Financials for this Owner
Home Financials are based on the most recent Mortgage that was taken out on this home.
Original Mortgage
$69,185
Interest Rate
7.05%
Purchase Details
Closed on
Sep 15, 2000
Sold by
Johnston Sally and Estate Of Sarah Poeschel
Bought by
Renzi Anthony
Home Financials for this Owner
Home Financials are based on the most recent Mortgage that was taken out on this home.
Original Mortgage
$63,000
Interest Rate
8.14%
Purchase Details
Closed on
Mar 24, 1988
Bought by
Poeschel Sarah
Create a Home Valuation Report for This Property
The Home Valuation Report is an in-depth analysis detailing your home's value as well as a comparison with similar homes in the area
Home Values in the Area
Average Home Value in this Area
Purchase History
| Date | Buyer | Sale Price | Title Company |
|---|---|---|---|
| Ziebel Anna C | -- | None Listed On Document | |
| Ziebel Anna C | -- | None Available | |
| Brandehoff Stephen N | $76,900 | Amerititle Agency Inc | |
| Renzi Anthony | $63,000 | Amerititle Agency Inc | |
| Poeschel Sarah | -- | -- |
Source: Public Records
Mortgage History
| Date | Status | Borrower | Loan Amount |
|---|---|---|---|
| Previous Owner | Brandehoff Stephen N | $69,185 | |
| Previous Owner | Renzi Anthony | $63,000 |
Source: Public Records
Tax History
| Year | Tax Paid | Tax Assessment Tax Assessment Total Assessment is a certain percentage of the fair market value that is determined by local assessors to be the total taxable value of land and additions on the property. | Land | Improvement |
|---|---|---|---|---|
| 2025 | $4,900 | $109,170 | $50,960 | $58,210 |
| 2024 | $4,900 | $109,170 | $50,960 | $58,210 |
| 2023 | $4,837 | $109,165 | $50,960 | $58,205 |
| 2022 | $4,118 | $79,390 | $16,490 | $62,900 |
| 2021 | $4,125 | $79,390 | $16,490 | $62,900 |
| 2020 | $4,130 | $79,390 | $16,490 | $62,900 |
| 2019 | $3,489 | $57,510 | $12,220 | $45,290 |
| 2018 | $2,641 | $51,320 | $12,220 | $39,100 |
| 2017 | $2,753 | $51,320 | $12,220 | $39,100 |
| 2016 | $2,395 | $36,160 | $10,050 | $26,110 |
| 2015 | $2,174 | $36,160 | $10,050 | $26,110 |
| 2014 | $2,180 | $36,160 | $10,050 | $26,110 |
| 2013 | $1,075 | $36,155 | $10,045 | $26,110 |
Source: Public Records
Map
Nearby Homes
- 272 E Jenkins Ave
- 354 Sheldon Ave
- 360 Sheldon Ave
- 284-286 E Markison Ave
- 415 Sheldon Ave
- 423 Sheldon Ave
- 348-350 E Moler St
- 218 E Markison Ave
- 236 E Welch Ave
- 326 Frebis Ave
- 220 E Welch Ave
- 1624 S 8th St
- 1563 S 6th St
- 513 E Jenkins Ave
- 148 E Welch Ave
- 379 E Morrill Ave
- 1366 S 4th St
- 165 Frebis Ave
- 332 E Hinman Ave
- 495 E Welch Ave
- 333 E Jenkins Ave
- 343 E Jenkins Ave
- 329 E Jenkins Ave
- 349 E Jenkins Ave
- 325 E Jenkins Ave
- 355 E Jenkins Ave
- 319 E Jenkins Ave
- 336 Southwood Ave
- 330 Southwood Ave
- 340 Southwood Ave
- 332 E E Jenkins Ave Ave
- 336 E Jenkins Ave
- 342 E Jenkins Ave
- 311 E Jenkins Ave
- 311 E Jenkins Ave Unit A-D
- 326 Southwood Ave
- 344 Southwood Ave
- 346 E Jenkins Ave
- 332 E Jenkins Ave
- 328 E Jenkins Ave
Your Personal Tour Guide
Ask me questions while you tour the home.